Canadian Dollar Technical Summary:
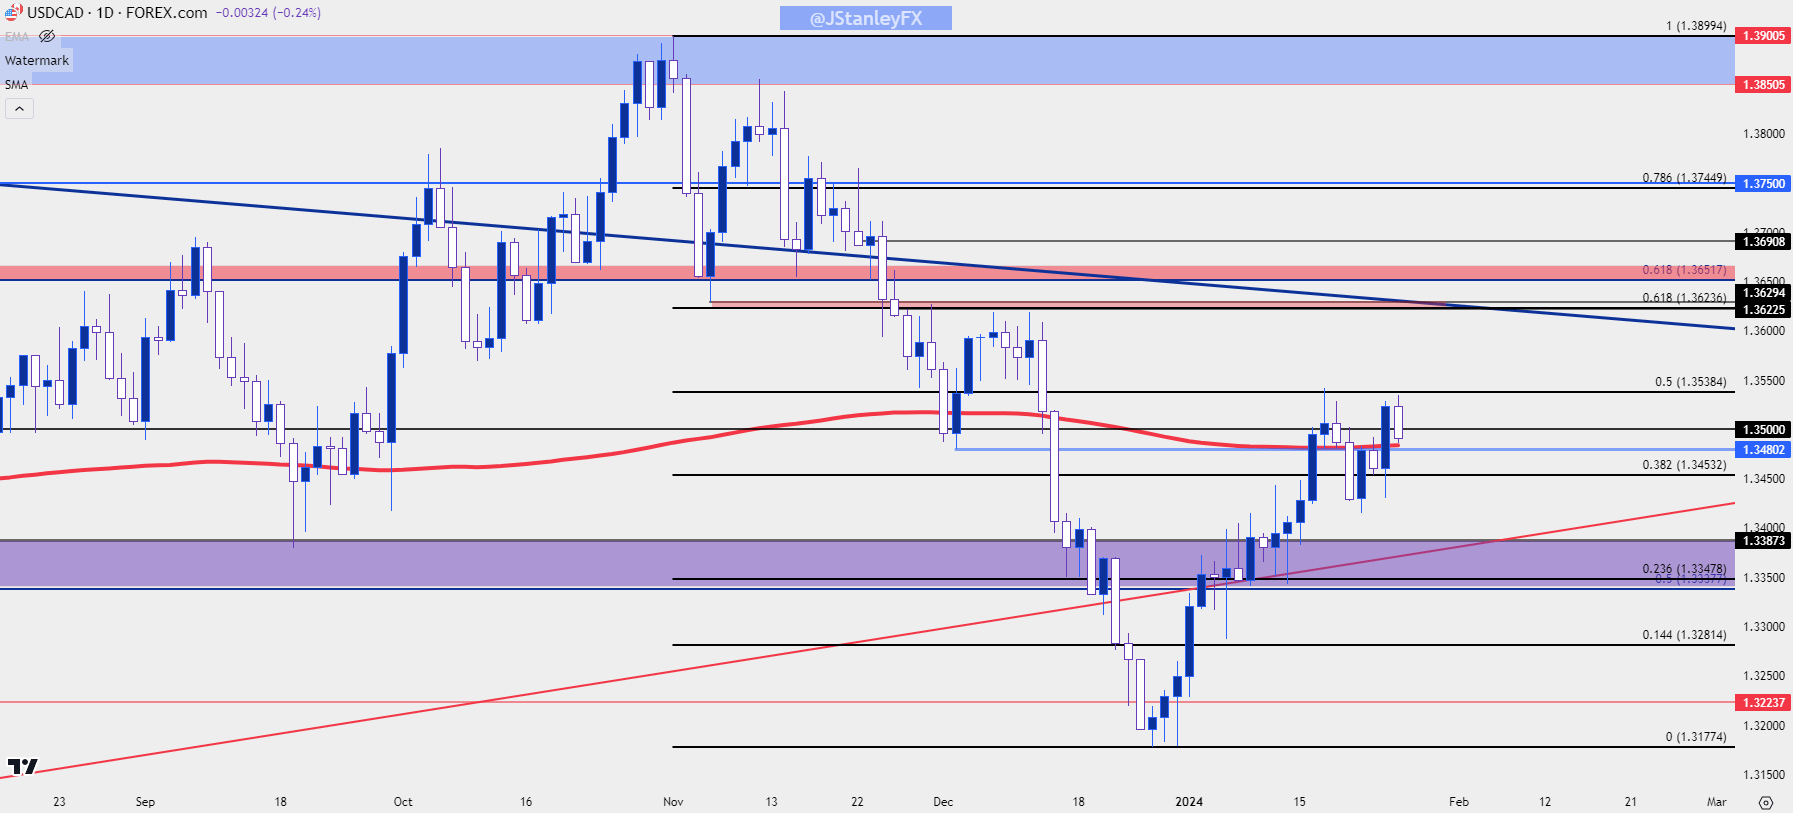
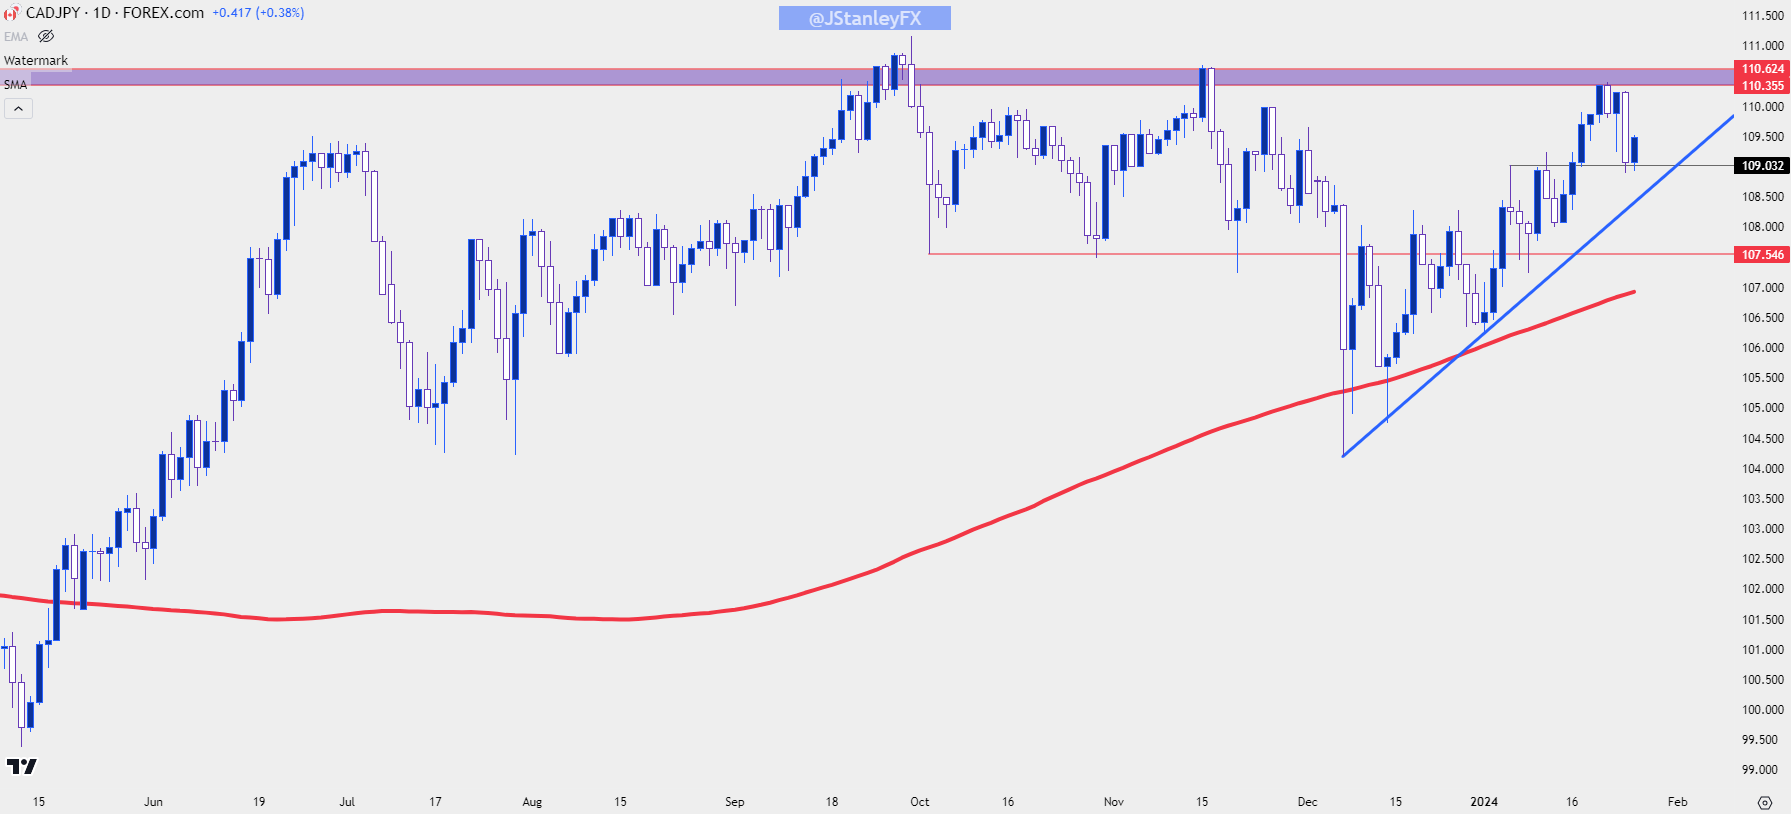
Canadian Dollar weakness has showed after the BoC rate decision yesterday, leading to another push above the 200DMA in USD/CAD. That move has pulled back before a re-test of the high, and price is now approaching a support test at a confluent area on the chart where the 200-day moving average is currently placed. CAD/JPY, on the other hand, has held resistance at a key spot on the chart which has held the highs for a year-and-a-half. This is just above the 110.00 psychological level, and this would be the fifth separate resistance test at that zone.
The Bank of Canada hinted that it’s done with rate hikes at this week’s BoC rate decision, and the Canadian Dollar weakened in response. The debate in Canada now mirrors the quandary in many other economies, and that’s the question of how long to keep policy in a restrictive place. This is similar to the scenario in the United States, where policy remains relatively restrictive, but inflation hasn’t yet been tamed below the target, so the wait continues. From BoC Governor Tiff Macklem yesterday during the press conference: “We want to be convinced that we’re on a path back to two percent inflation. When we have more assurances that we’re on that path, we can start discussing lowering interest rates. But we’re not there yet.”
This sounds like the same refrain as the Federal Reserve in late-Summer of last year; but that message from the Fed began to soften even more in November and December when Chair Powell began to open the door wider to the prospect of rate cuts on the horizon. Tomorrow brings the next piece of the inflation puzzle into the picture with the release of U.S. Core PCE, which is expected to print at an annualized 3.0%.
That would be the lowest reading on the indicator since the release in April of 2021, and if it prints below expectations, at an annualized 2.9% or less, then we may see that risk-on behavior heat up even more in anticipation of an even greater dovish push from the Fed at next week’s rate decision.
At this point, the US Dollar remains relatively strong as it continues to test the 200-day moving average, which I had looked at in yesterday’s webinar along with last Friday’s USD Forecast. There is some deviation with the backdrop in USD/CAD, however, as the pair has already broken-above its 200DMA and is currently testing for higher-low support in that range.
The current high has held at the 50% mark of the sell-off that began in November, around that FOMC rate decision and when that price came into play last week it led to a forceful pullback. But bulls got back into the driver’s seat on Monday, pushed through yesterday’s rate decision and at this point there remains bullish continuation potential as taken from the continued higher-highs and higher-lows that have shown so far this year.
USD/CAD Daily Price Chart
 Chart prepared by James Stanley, USD/CAD on Tradingview
CAD/JPY
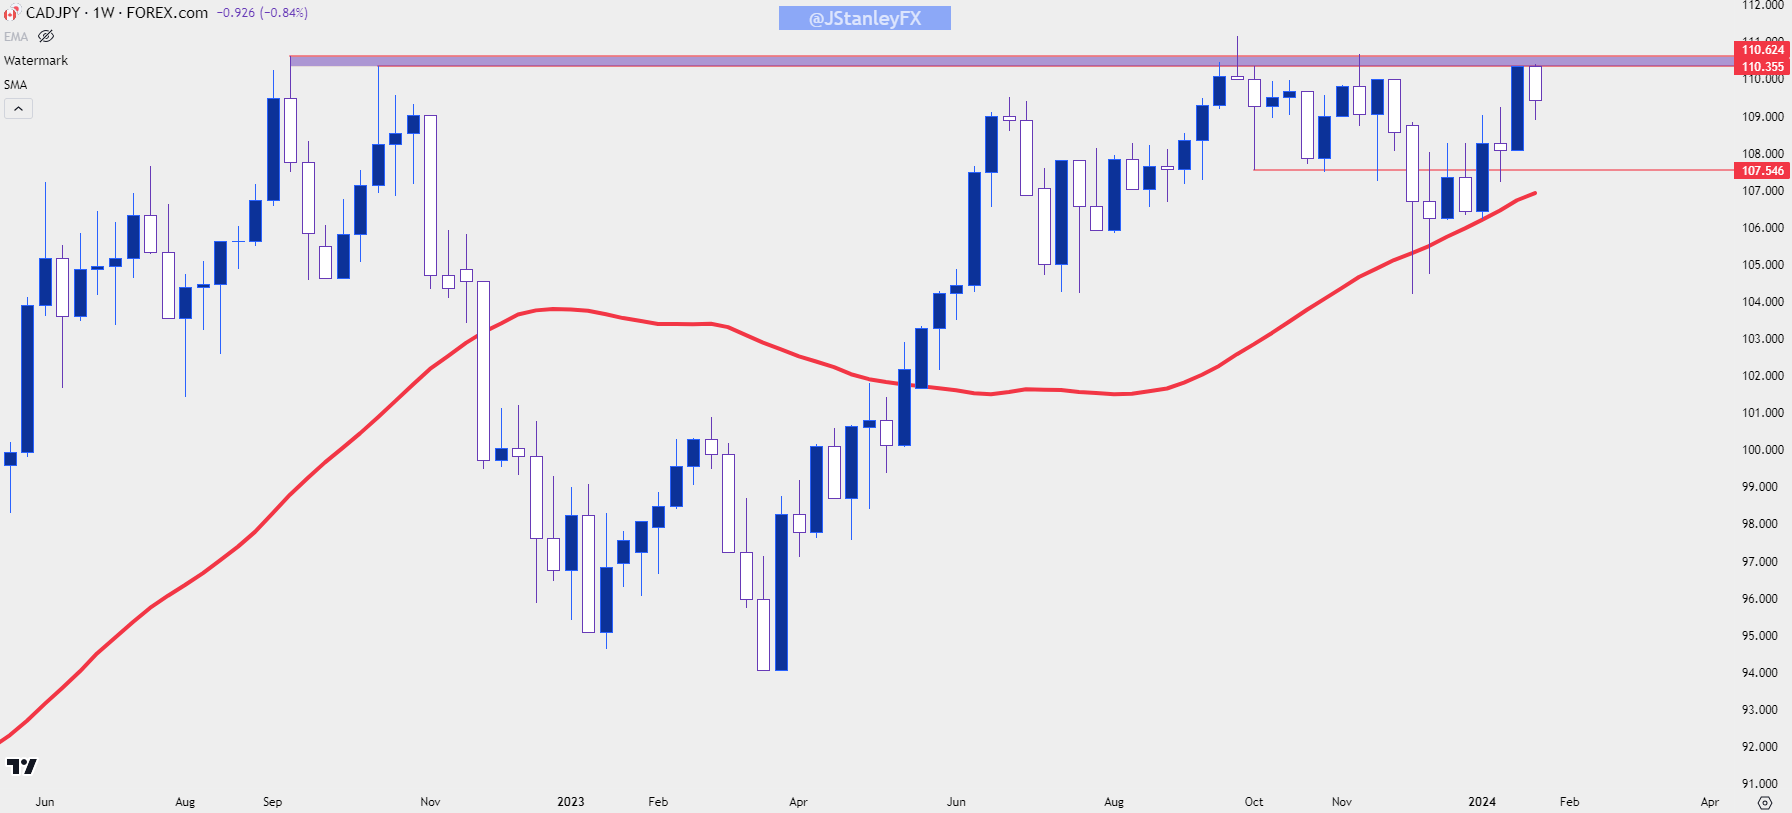
CAD/JPY continues to test a massive spot of resistance around the 110.00 handle, and this isn’t a new occurrence as that resistance has been in-play since September of 2022. I’m tracking this zone from the swing highs in 2022 that range from 110.36 up to 110.62, and the prior test in that zone was met with a harsh sell-off in mid-November as Yen-strength began to appear. But as the BoJ avoided the topic of rate hikes inflation in Japan began to soften and as the door opened into 2025, Yen-weakness was back in a very big way, helping to propel the pair right back up to this key zone that marked the highs both last Friday and this Monday.
You’ll probably also noticed that the pullback in November found support at the 200-day moving average, plotted on the below weekly chart, and notably, there wasn’t a single daily close below that indicator during that support test.
CAD/JPY Weekly Price Chart
 Chart prepared by James Stanley, CAD/JPY on Tradingview
From the daily chart below, an ascending triangle formation could be argued, as there’s both horizontal resistance to go along with a recent series of higher-lows. This chart also highlights a couple of key zones for support potential, the first of which has already come into play this morning around the 109.00 level, with another around the 107.55 area.
CAD/JPY Daily Price Chart
 Chart prepared by James Stanley, CAD/JPY on Tradingview
--- written by James Stanley, Senior Strategist


