Canadian Dollar Technical Forecast: USD/CAD Weekly Trade Levels
- Canadian Dollar marks snaps two-week losing streak- threatens trend resumption
- USD/CAD plummets back towards key technical pivot zones- risk for price inflection
- Resistance 1.3225, 1.3309, ~1.3409– support 1.3107/11, 1.2990-1.3023(key), 1.2807
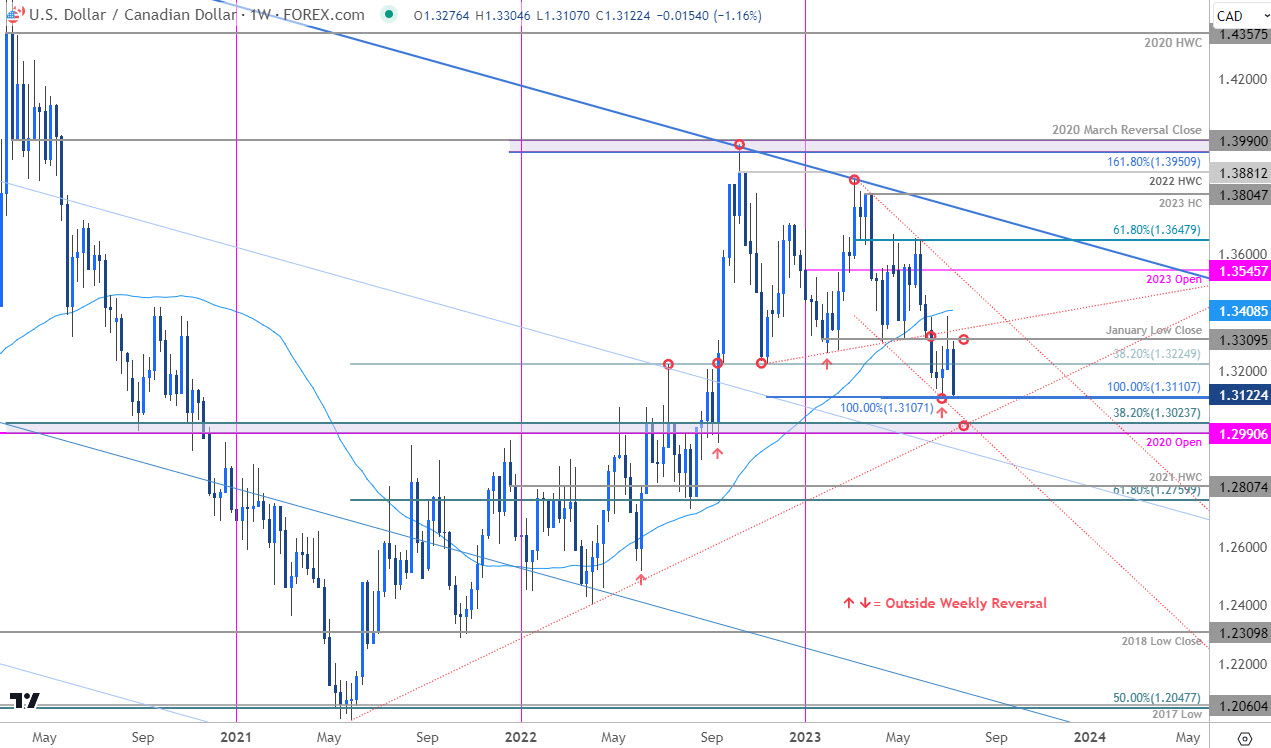
The Canadian Dollar surged nearly 2% against the US Dollar in the past five-days with USD/CAD plunging back towards the yearly lows. Although the near-term outlook remains weighted to the downside, the decline is approaching a more significant technical zone just lower, and the threat rises for possible price inflection into confluent trend support. These are the updated targets and invalidation levels that matter on the USD/CAD weekly technical chart.
Review my latest Weekly Strategy Webinar for an in-depth breakdown of this Loonie setup and more. Join live on Monday’s at 8:30am EST.
Canadian Dollar Price Chart – USD/CAD Weekly

Chart Prepared by Michael Boutros, Sr. Technical Strategist; USD/CAD on TradingView
Technical Outlook: In last month’s Canadian Dollar Technical Forecast we highlighted the potential for a significant technical breakdown in USD/CAD as price was attempting to breakout of numerous formations we’ve been tracking for months now. We noted that, “close below the 38.2% Fibonacci retracement of the 2021 rally at 1.3225 this week would keep the focus on subsequent support objectives at 1.3107/11 (two-equal legs off the 20223 / 2022 highs respectively) and 1.2990-1.3023- an area of interest for possible downside exhaustion IF reached (broader bullish invalidation for the 2021 uptrend).”
Price registered an intraweek low two-weeks later at 1.3116 before mounting a counteroffensive that failed into former trend support the following week. Failure to mark a weekly close above the January low-close at 1.3309 was further exacerbated by softer-than-expected US inflation data and once again takes Loonie into pivotal support.
The levels are unchanged heading into the close of the week- initial weekly resistance steady at 1.3225 backed by bearish invalidation at 1.3309. Ultimately a close above the 52-week moving average (currently ~1.3409) would be needed to suggest a more significant low is in place.
The immediate focus is on a reaction into 1.2990-1.3023 IF reached. Note that a break below this threshold would likely fuel another accelerated sell-off with the next major support zone eyed near the 1.28-handle.
Bottom line: USD/CAD is once again testing key pivot zone with a more significant technical confluence seen just lower at trend support. From at trading standpoint, look to reduce short-exposure / lower protective stops on a stretch towards the 1.30-handle – rallies should be limited to 1.3225 IF price is heading lower.
Keep in mind that the trend has matured on this stretch and ultimately, we are on the lookout for a possible exhaustion-low / price inflection on a test of trend support in the weeks ahead. Review my latest Canadian Dollar Short-term Outlook for a closer look at the near-term USD/CAD technical trade levels.
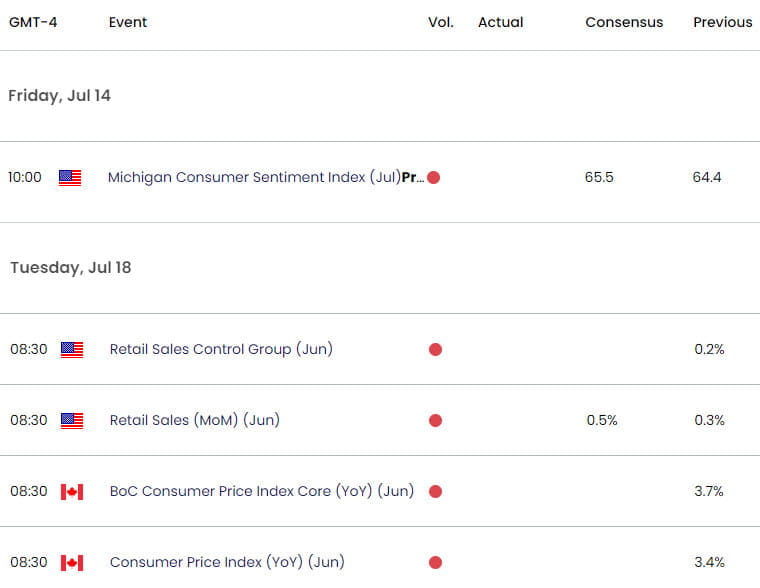
US/ Canada Economic Data Releases

Economic Calendar - latest economic developments and upcoming event risk.
Active Weekly Technical Charts
- Euro (EUR/USD)
- British Pound (GBP/USD)
- US Dollar (DXY)
- Australian Dollar (AUD/USD)
- Crude Oil (WTI)
- Gold (XAU/USD)
--- Written by Michael Boutros, Sr Technical Strategist with FOREX.com
Follow Michael on Twitter @MBForex


