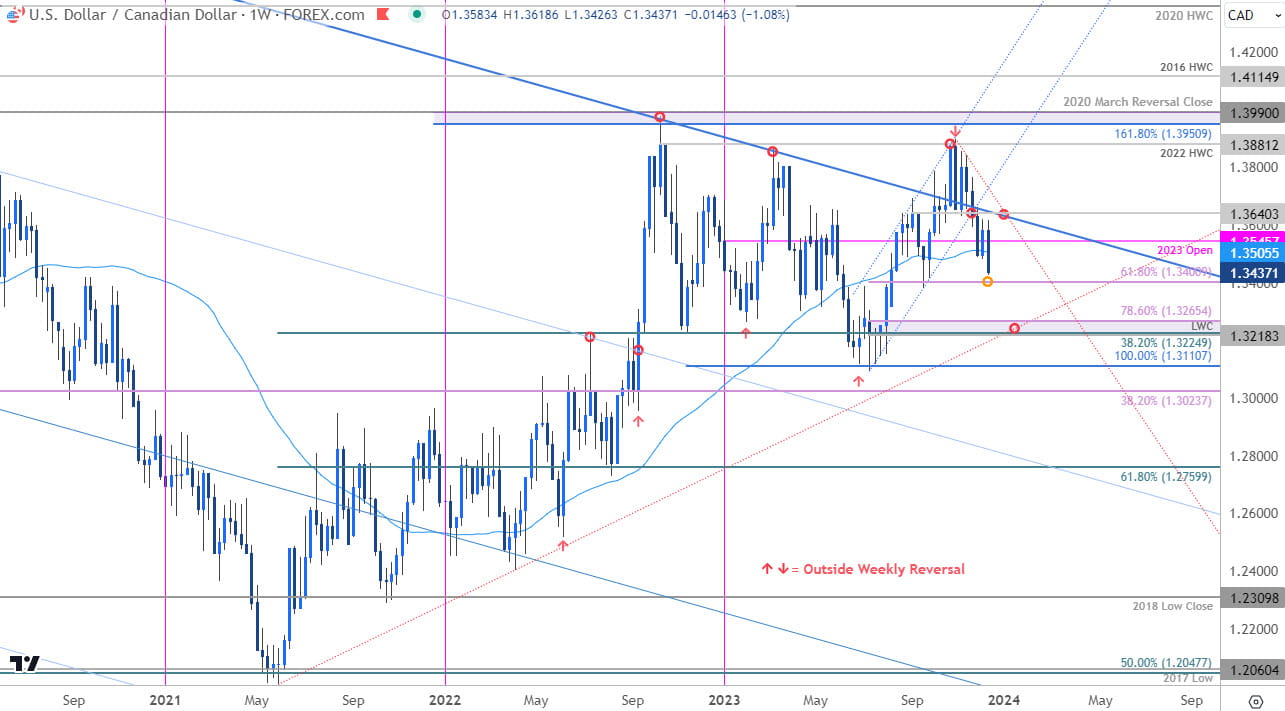
Canadian Dollar Technical Forecast: USD/CAD Weekly Trade Levels
- Canadian Dollar breaks multi-month uptrend - trades back below yearly-open / 52WMA
- USD/CAD Fed pullback approaching key Fibonacci support– risk for price inflection
- Resistance 1.3505, 1.3545, 1.3640 – Support 1.3401, 1.3218/65, 1.3110
The Canadian Dollar rallied more than 1.1% against US Dollar this week with USD/CAD free-falling to multi-month lows. A break of the July uptrend last month has seen price plunge back below the objective 2023 yearly open with the first major support hurdle now in view. These are the updated targets and invalidation levels that matter on the USD/CAD weekly technical chart.
Review my latest Weekly Strategy Webinar for an in-depth breakdown of this Loonie setup and more. Join live on Monday’s at 8:30am EST.
Canadian Dollar Price Chart – USD/CAD Weekly

Chart Prepared by Michael Boutros, Sr. Technical Strategist; USD/CAD on TradingView
Technical Outlook: In last month’s Canadian Dollar Technical Forecast we noted that USD/CAD was in, “consolidation within the November opening-range, just above multi-month uptrend support- look to the breakout for guidance here. From a trading standpoint, we’re looking to validate a possible exhaustion high as price struggles to breach the objective 2023 range.” Price plunged the following week with a break of the July uptrend fueling a decline of more than 3.4% off the yearly highs.
The sell-off is now approaching Fibonacci support at the 61.8% retracement of the 2023 range at 1.3401. A break / weekly close below this threshold is needed to keep the immediate short-bias viable with such a scenario exposing a major slope confluence at 1.3218/65- a region defined by the yearly low-week close, 38.2% retracement of the 2021 advance, and the 78.6% retracement. Look for a larger reaction there IF reached.
Initial resistance now stands with the 52-week moving average near 1.3505 and is backed closely by the objective 2023 yearly-open at 1.3545. Medium-term bearish invalidation is now lowered to the September high-week close at 1.3640- a breach / close above this threshold would ultimately be needed to mark uptrend resumption.
Bottom line: A break below a multi-month uptrend in USD/CAD is now approaching initial support hurdles. From a trading standpoint, look to reduce portions of short-exposure / lower protective stops on a test of 1.34- rallies should be limited to 1.3640 IF price is heading lower here with a weekly-close below this pivot zone needed to fuel a test of multi-year trend support. Review my latest Canadian Dollar Short-term Outlook for a closer look at the near-term USD/CAD technical trade levels.
US/ Canada Economic Data Releases

Economic Calendar - latest economic developments and upcoming event risk.
Active Weekly Technical Charts
- British Pound (GBP/USD)
- Japanese Yen (USD/JPY)
- Australian Dollar (AUD/USD)
- Gold (XAU/USD)
- Euro (EUR/USD)
- US Dollar Index (DXY)
--- Written by Michael Boutros, Sr Technical Strategist with FOREX.com
Follow Michael on X @MBForex


