Canadian Dollar, USD/CAD Talking Points:
- USD/CAD established a fresh 2023 high last week after the Bank of Canada rate decision.
- That breakout extended through the end of the week and the pair has begun a test of a resistance zone that runs from 1.3850-1.3900.
- The FOMC rate decision looms large on this week’s calendar, but Friday brings employment reports out of both the United States and Canada and this can certainly keep the pair on the move.
USD/CAD has broken out to a fresh 2023 high after the Bank of Canada’s rate decision last Wednesday. Last week started off with a pullback in the pair but by the time the Tuesday webinar came around, there was a show of defense at a key spot of support, which had left the pair in a somewhat bullish position ahead of that rate meeting at the BoC.
Since then, price has continued to stretch with Wednesday through Friday of last week producing a bullish result for USD/CAD. On the below weekly chart, we can see that breakout running into the next zone of resistance, which spans from 1.3850-1.3900; and there’s additional resistance overhead if bulls can continue the push, taken from around the 1.4000 psychological level.
USD/CAD Weekly Price Chart
 Chart prepared by James Stanley, USD/CAD on Tradingview
USD/CAD Bigger Picture Considerations
The breakout that showed last week offered potential resolution to a symmetrical triangle that’s been building for the past three years. But it’s that space above the 1.4000 level that seems imposing for bulls as it’s thwarted topside trends twice in a very big way, most recently in 2020, around the onset of the pandemic.
This doesn’t mean that the breakout cannot stretch further, but it does highlight the challenge for bulls with continuation scenarios, especially on a shorter-term basis considering how fast the move from last week has priced in.
USD/CAD Monthly Price Chart
 Chart prepared by James Stanley, USD/CAD on Tradingview
USD/CAD Shorter-Term
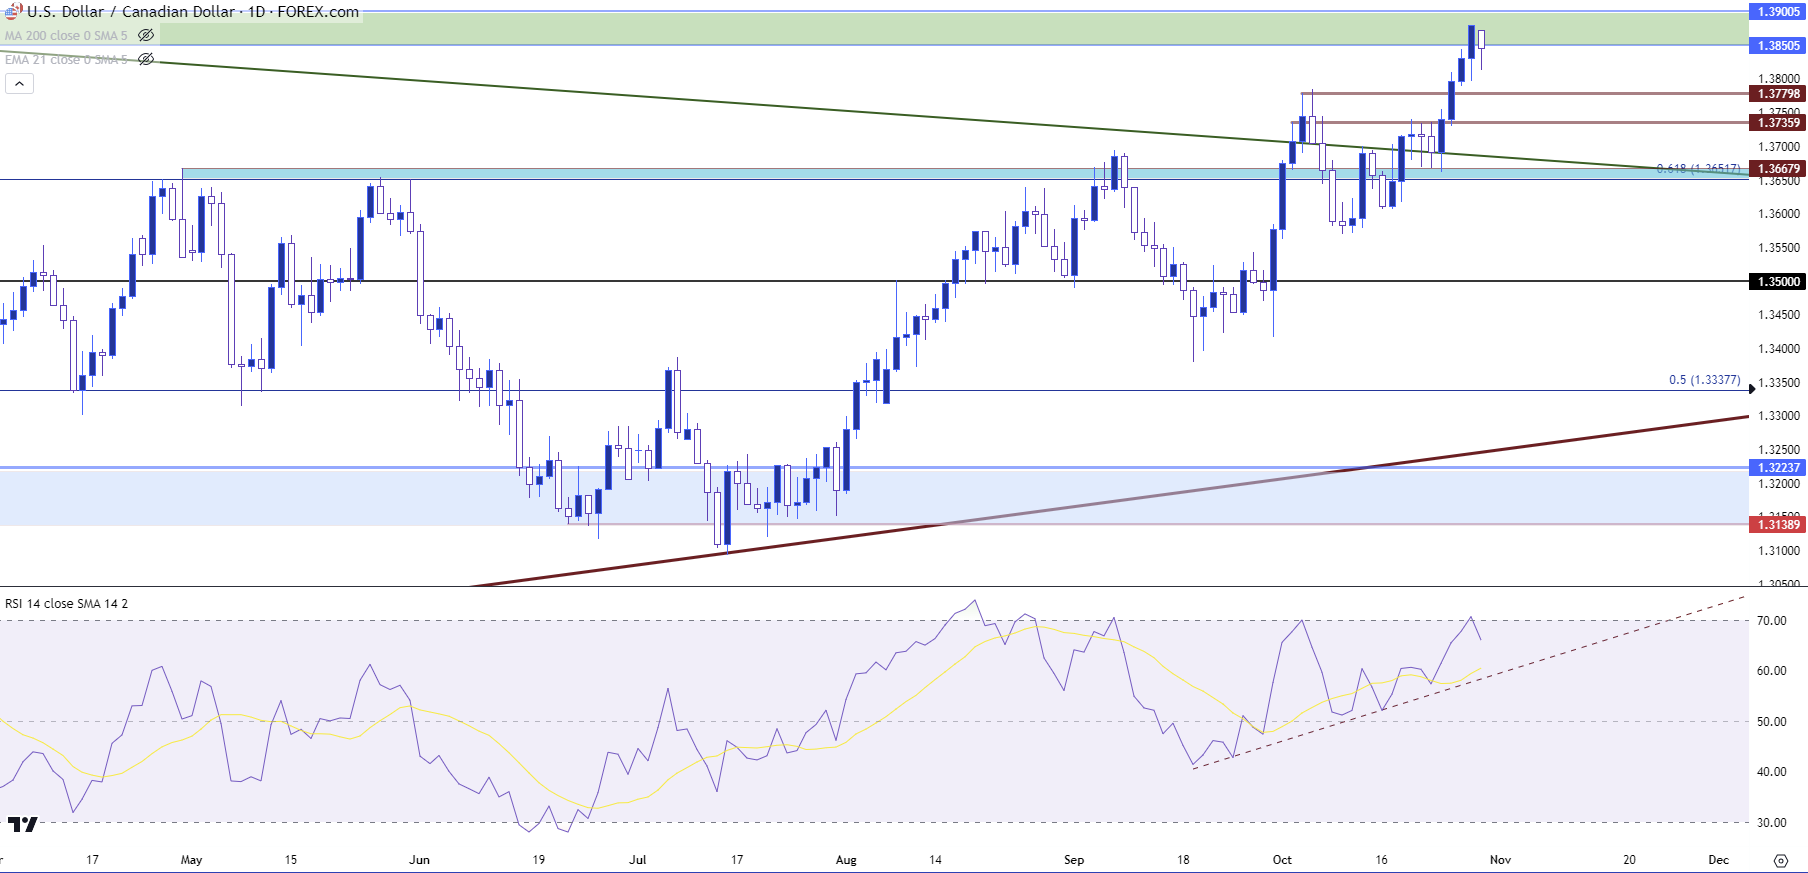
With that long-term resistance zone starting to come into play, the natural question would be one of continuation potential. And the trend has been really strong, only beginning to show stall after this week’s open. Also of note is the fact that RSI on the daily chart had a quick test of overbought last Friday, which further enforces the challenge for bulls whilst price is so near a big picture resistance zone.
This could, however, keep the door open for higher-low support potential on pullback plays. There’s a nearby spot pulled from the daily chart around the prior October high that showed around he previous overbought RSI reading. That plots around 1.3780, and there’s another prior swing of resistance-turned-support at 1.3736, which could function as an ‘s2’ spot of support for the pair.
Below that remains a major spot of interest at 1.3652. This is a Fibonacci level that’s continued to come back into the picture on USD/CAD. Last week, bulls held the low just above that price, which has helped to create a support zone around the level that spans up to 1.3658. This can be tracked as an ‘s3’ spot of support and if bulls can’t hold the lows there, last week’s breakout will begin to look like a failure and bulls will likely want to reassess continuation scenarios in the pair.
USD/CAD Daily Price Chart
 Chart prepared by James Stanley, USD/CAD on Tradingview
--- written by James Stanley, Senior Strategist


