Canadian Dollar Technical Forecast: USD/CAD Weekly Trade Levels
- USD/CAD reversal off technical resistance- June opening-range breakout in focus
- Canadian Dollar May rally vulnerable below 2024 close high - FOMC rate decision on tap
- Resistance 1.3773, 1.3849/81 (key), 1.3990– Support 1.3590, 1.3511/31, 1.3432
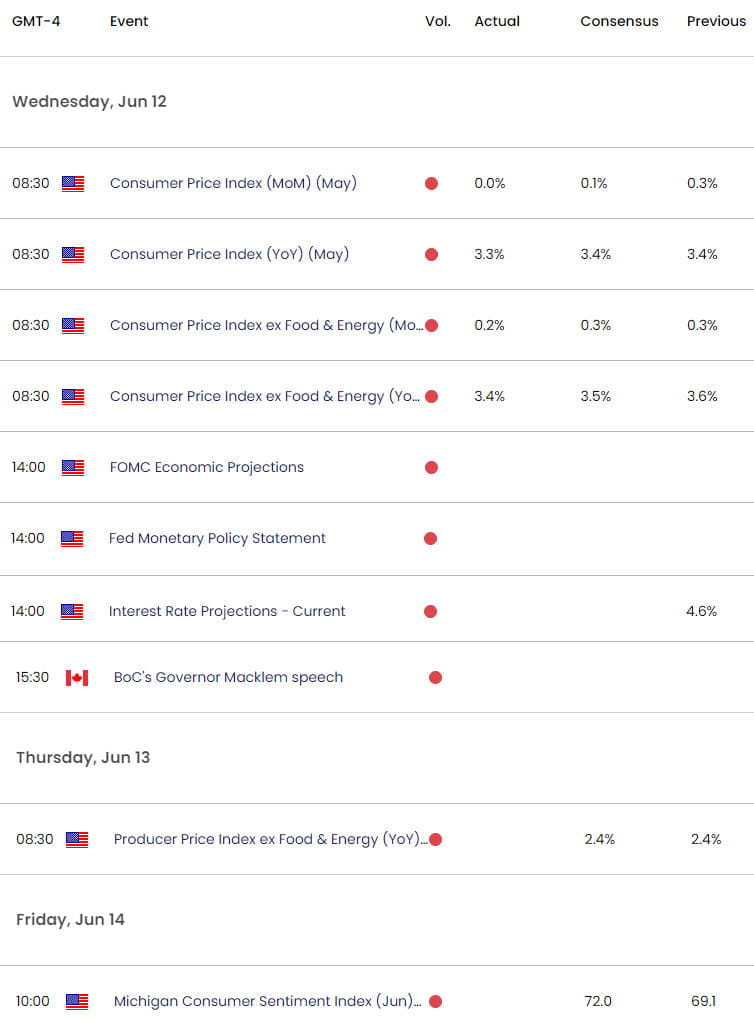
The Canadian Dollar bulls got a boost today on the heels of softer-than-expected US inflation data with USD/CAD paring a more than 50% of last week’s 1% rally. All eyes now fall on the Federal reserve interest rate decision later this afternoon with a breakout of last week’s range to offer further guidance into the close of the month. Battle lines drawn on the USD/CAD weekly technical chart.
Review my latest Weekly Strategy Webinar for an in-depth breakdown of this Loonie setup and more. Join live on Monday’s at 8:30am EST.
Canadian Dollar Price Chart – USD/CAD Weekly

Chart Prepared by Michael Boutros, Sr. Technical Strategist; USD/CAD on TradingView
Technical Outlook: In last month’s Canadian Dollar Technical Forecast we noted, “From a trading standpoint, the risk remains for a deeper correction after the exhaustion high marked last month and we’re on the lookout for an exhaustion low in the weeks ahead with a close above 1.3881 needed to validate a larger breakout in price.” Price registered an intraweek low at 1.3590 the following week with USD/CAD holding this same range for over seven-weeks now.
Support rests with the May low / 38.2% retracement of the December rally at 1.3590 and is backed closely by the 200day moving average around 1.3530. Broader bullish invalidation remains unchanged at the 61.8% Fibonacci retracement at 1.3432.
Resistance is eyed with the yearly high-close (HC) at 1.3773 with 1.3849/81 still key- a region defined by the 100% extension of the December rally and objective 2022 high-week close (HWC). A breach / weekly close above this threshold would ultimately be needed to validate a breakout of the multi-year consolidation formation in USD/CAD. Subsequent topside objectives eyed at the March 2020 weekly-reversal close at 1.3990 and the 1.618% extension / 2016 HWC at 1.4114/15.
Bottom line: USD/CAD has been holding a well-defined range (1.3590-1.3773) for nearly two-months and the focus is on a breakout of this key zone in the weeks ahead. From a trading standpoint, losses would need to be limited to the January channel line IF price is heading higher on this stretch with a close above 1.3881 needed to validate a breakout of a multi-year consolidation formation.
Keep in mind today’s Fed rate decision has the potential to charge considerable volatility here as traders comb through the updated economic projections and the interest rate dot plot. Stay nimble into the release and watch the weekly close here for guidance. I’ll publish an updated Canadian Dollar Short-term Outlook once we get further clarity on the near-term USD/CAD technical trade levels.
US/ Canada Economic Data Release

Economic Calendar - latest economic developments and upcoming event risk.
Active Weekly Technical Charts
- Japanese Yen (USD/JPY)
- US Dollar Index (DXY)
- Gold (XAU/USD)
- Euro (EUR/USD)
- British Pound (GBP/USD)
- Crude Oil (WTI)
- Australian Dollar (AUD/USD)
--- Written by Michael Boutros, Sr Technical Strategist with FOREX.com
Follow Michael on X @MBForex


