Canadian Dollar Technical Forecast: USD/CAD Weekly Trade Levels
- Canadian Dollar set to snap four-week losing streak – USD/CAD bulls fail to mount 1.35
- USD/CAD late-December rally vulnerable – key support in view with NFPs on tap
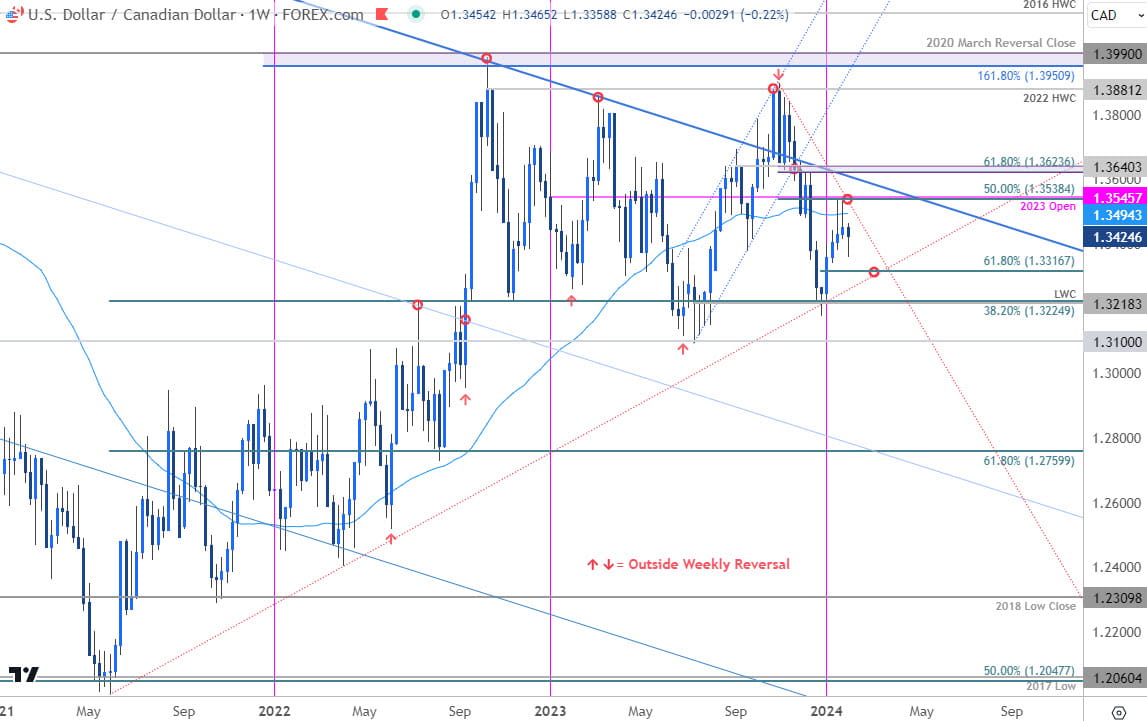
- Resistance ~1.3494, 1.3538/45, 1.3623/40– Support 1.3316, ~1.3270s, 1.3218/25
The Canadian Dollar is back on offense with USD/CAD pulling back more than 1.3% off the January highs. Price has failed to mount the 1.35- handle for the past two-weeks and leaves the late-December rally vulnerable in the days ahead. These are the updated targets and invalidation levels that matter on the USD/CAD weekly technical chart heading into Non-Farm Payrolls (NFP) tomorrow.
Review my latest Weekly Strategy Webinar for an in-depth breakdown of this Loonie setup and more. Join live on Monday’s at 8:30am EST.
Canadian Dollar Price Chart – USD/CAD Weekly

Chart Prepared by Michael Boutros, Sr. Technical Strategist; USD/CAD on TradingView
Technical Outlook: In last month’s Canadian Dollar Technical Forecast we noted that USD/CAD had, “rebounded off confluent uptrend support with the immediate focus on this recovery. From a trading standpoint, look to reduce long-exposure / raise protective stops on a stretch towards the October trendline – risk for an exhaustion high into 1.3545.” Price briefly registered an intraday high at 1.3542 the following week before exhausting. A second attempt failed again just ahead of this threshold with USD/CAD now threatening to snap a four-week winning streak.
Initial weekly support rests with the 61.8% Fibonacci retracement of the December rally at 1.3316 backed closely by the 2021 trendline (currently 1.3270s). Critical support remains unchanged at 1.3218/25 – a region defined by the 2023 low-week close (LWC) and the 38.2% retracement of the 2021 advance. Ultimately, a break / weekly close below this threshold would be needed to suggest a larger trend reversal is underway in USD/CAD.
Initial weekly resistance is eyed along the 52-week moving average (currently ~1.3494) with medium-term bearish invalidation steady at the 2023 yearly open / 50% retracement at 1.3538/45. A breach / weekly close above the 61.8% retracement / September high-week close at 1.3623/40 would be needed to mark uptrend resumption.
Bottom line: USD/CAD failed at technical resistance for the past two-weeks and leaves the late-December rally vulnerable into the February open. From at trading standpoint, the focus is on possible downside exhaustion in the weeks ahead- losses should be limited to by 2021 trendline (red) IF USD/CAD is heading higher on this stretch with a close above 1.3545 still needed to fuel the next leg higher in price. Stay nimble into tomorrow’s NFP releases and watch the weekly close here for guidance. Review my latest Canadian Dollar Short-term Outlook for a closer look at the near-term USD/CAD technical trade levels.
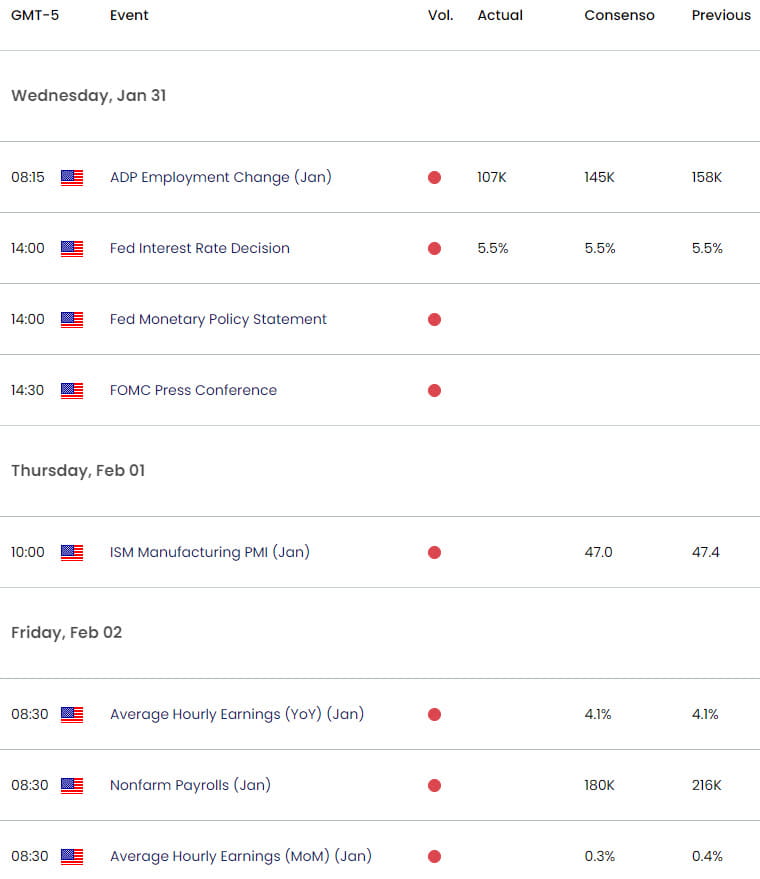
US/ Canada Economic Data Releases

Economic Calendar - latest economic developments and upcoming event risk.
Active Weekly Technical Charts
- British Pound (GBP/USD)
- Gold (XAU/USD)
- Australian Dollar (AUD/USD)
- US Dollar Index (DXY)
- Euro (EUR/USD)
- Japanese Yen (USD/JPY)
--- Written by Michael Boutros, Sr Technical Strategist with FOREX.com
Follow Michael on X @MBForex


