Canadian Dollar, USD/CAD Talking Points:
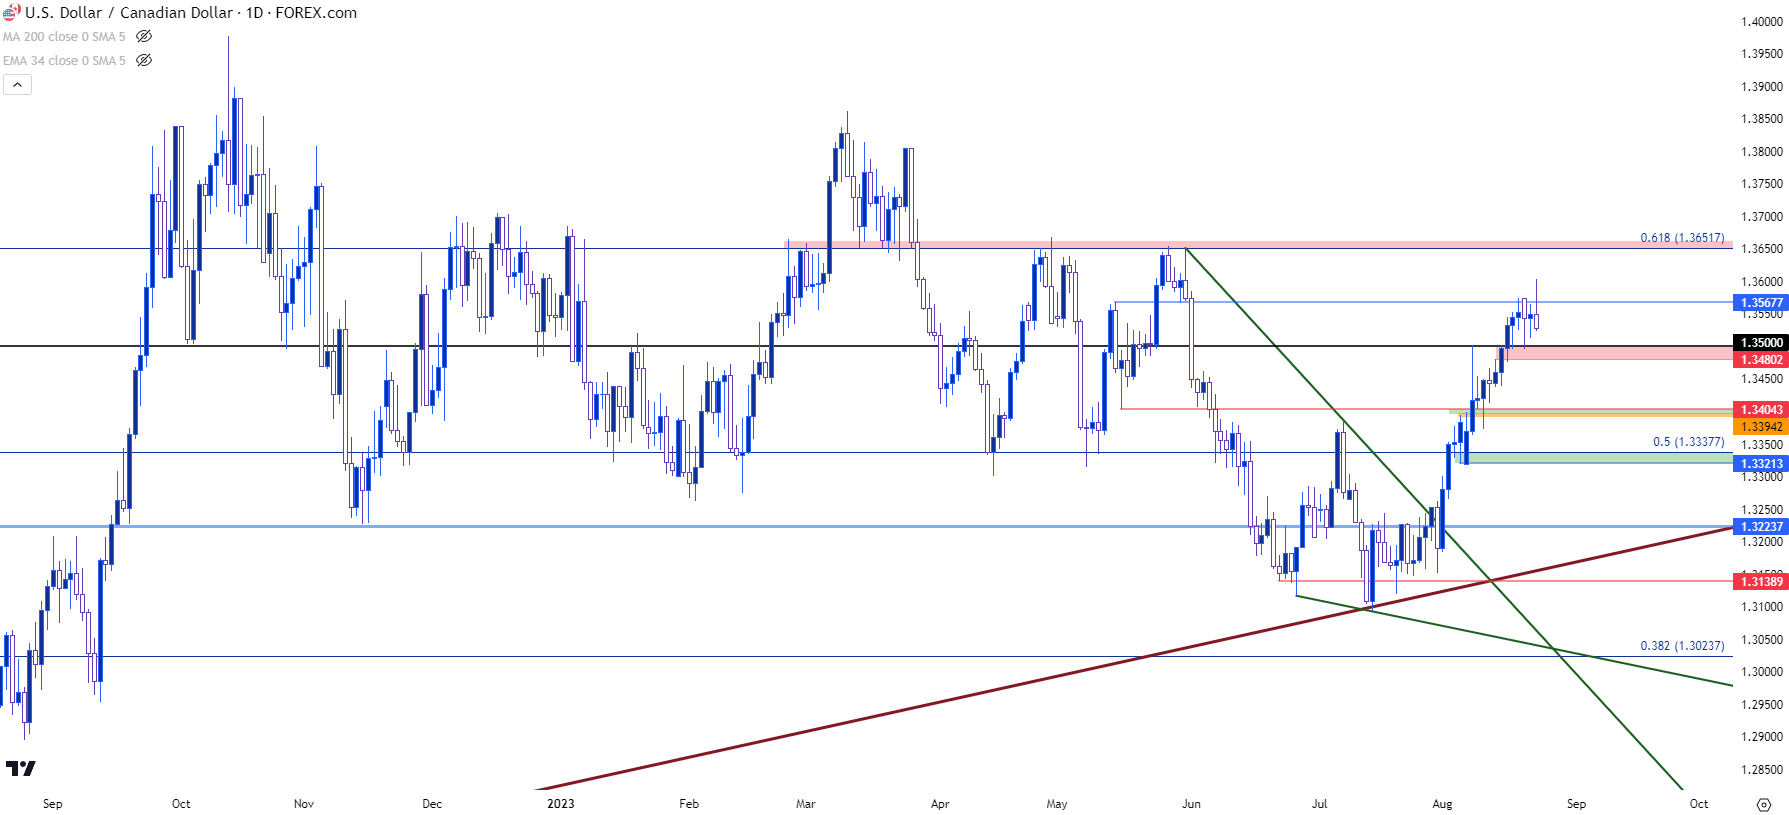
- USD/CAD has been one of the cleaner major FX pairs for USD bulls and this morning showed yet another fresh two-month high when the pair pushed up for a test at the 1.3600 handle.
- This morning’s breakout has so far failed and that’s now showing an extended upper wick on the daily chart, which highlights deeper pullback potential. The 1.3500 level that I’ve been following has already shown a few different support bounces after setting resistance earlier in August.
- I’ll be discussing these themes in-depth in the weekly webinar on Tuesday at 1PM ET. It’s free for all to register: Click here to register.
US Dollar strength has come back to life over the past month and few major FX markets show that as cleanly as USD/CAD. This morning marked yet another fresh two-month-high for the pair as USD/CAD pushed up for a test of the 1.3600 handle, but that was just before the release of US PMIs that all printed below expectations, helping to elicit a pullback in the USD. In USD/CAD this has produced an upper wick on the daily bar highlighting failure of that breakout – and this also puts emphasis back on the 1.3500 level that’s already been tested a few times as support, after showing as resistance earlier in the month of August.
USD/CAD Daily Price Chart

Chart prepared by James Stanley, USD/CAD on Tradingview
USD/CAD Shorter-Term
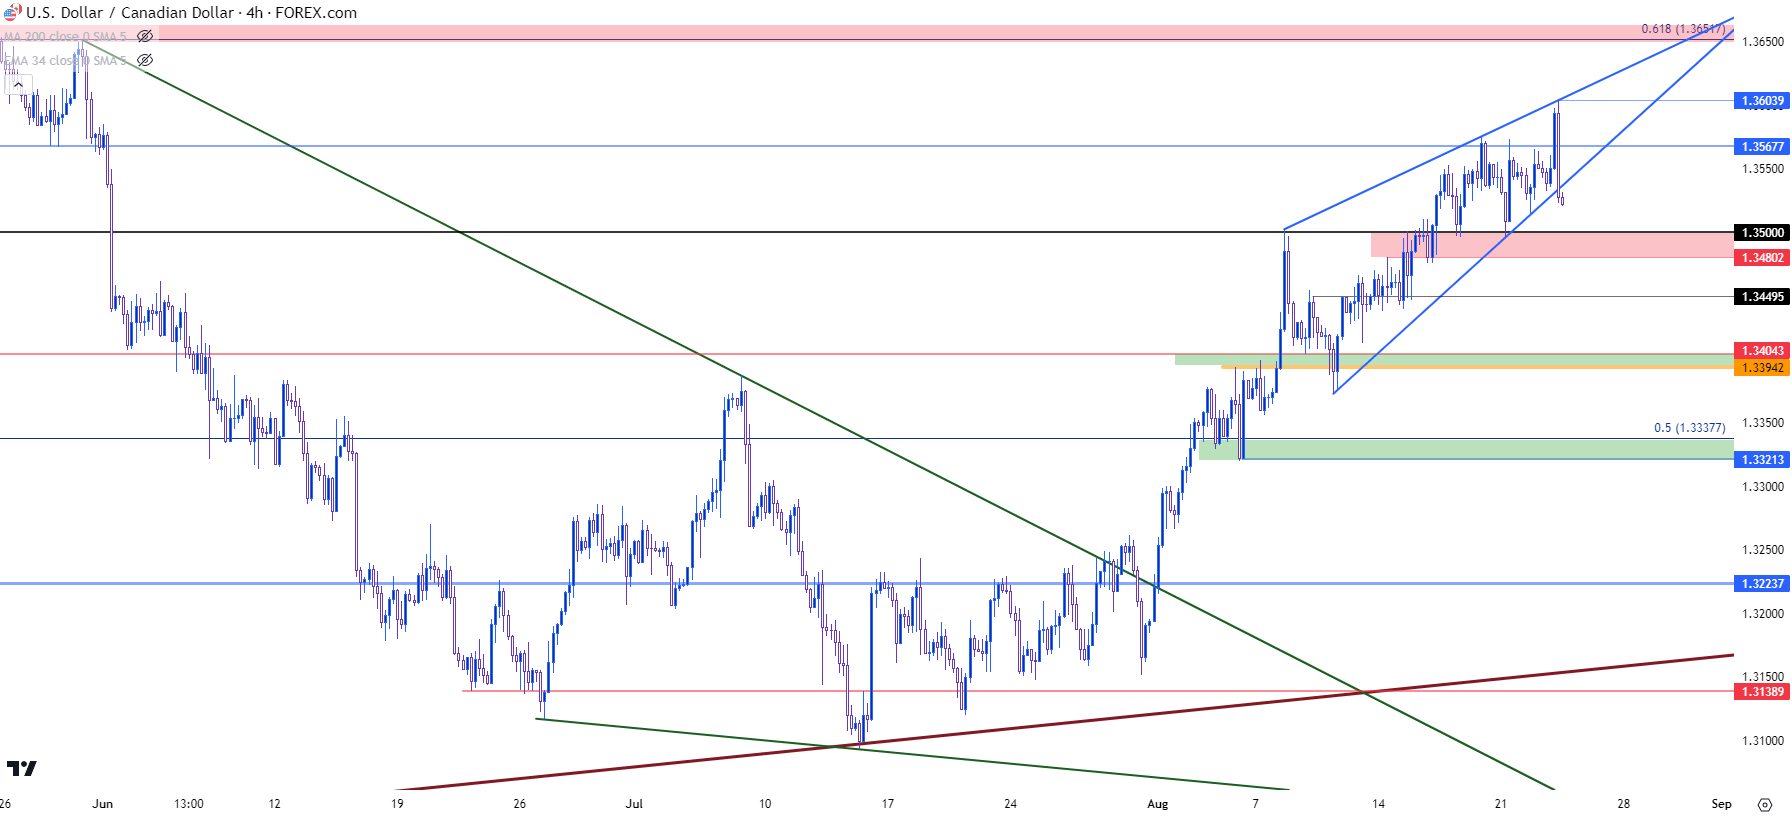
As looked at over the past couple of weeks, the breakout in USD/CAD has been aggressive and that was before price mounted above the 1.3500 psychological level.
But, since then the rally has built in an uneven manner, showing as a rising wedge formation. These formations are often approached with aim of bearish reversals and in this case, that could be a simple lead-in to a pullback type of scenario.
As you can see from the four-hour chart below price has already started to venture through the bottom of that formation, and this opens the door for a re-test of the 1.3500 handle. And if that can’t hold the low, then 1.3480 comes into the picture, followed by 1.3450. The next zone of key support runs from 1.3394-1.3404 and if that doesn’t hold then the bullish breakout will begin to look like a failure. The next key zone after that is the 1.3321-1.3338 area that was last in play as higher-low support two weeks ago.
USD/CAD Four-Hour Price Chart

Chart prepared by James Stanley, USD/CAD on Tradingview
USD/CAD Big Picture
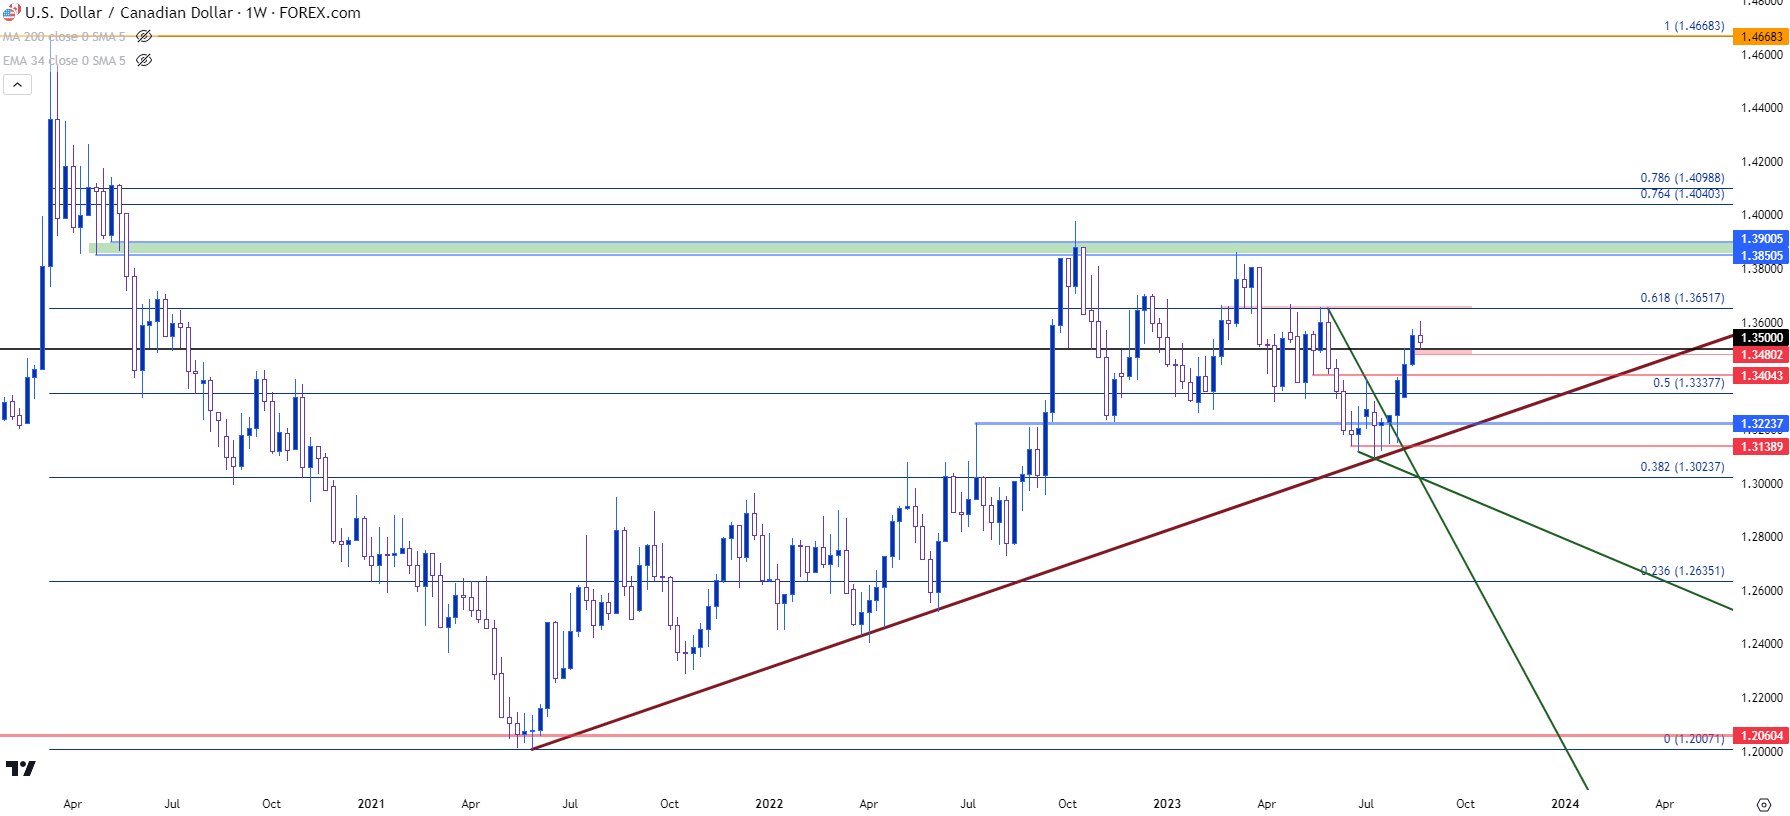
Taking a step back to the weekly chart and bullish potential remains in the pair and given how quickly the August breakout has priced-in, a pullback here could make sense for bullish continuation scenarios.
For the longer-term theme, the notable item was the solidification of support that held through late-June and most of July, which allowed for the falling wedge formation to build. The directional break that’s since shown in August has remained strong for much of the move which is why a pullback from a shorter-term rising wedge formation can still allow for bulls to remain the drivers seat, as long as support continues to be defended.
On the resistance side of the coin, the 1.3652 Fibonacci level looms large. This was support in Q1 before becoming resistance in Q2 and, eventually, was the last resistance touch before bears went for break in June trade. Bears ultimately failed, eventually finding support at the long-term bullish trendline which set the low last month.
Above 1.3652, there’s a longer-term zone of interest running from 1.3850-1.3900. This was a group of failed higher lows in 2020 trade that have since come back to show two separate instances of resistance over the past year.
USD/CAD Weekly Price Chart

Chart prepared by James Stanley, USD/CAD on Tradingview
--- written by James Stanley, Senior Strategist


