Brazilian Real Talking Points:
- The Brazilian Real showed weakness against both the US Dollar and the Euro this week, although the move in EUR/BRL may retain more attraction for those looking for Real weakness given the larger technical context.
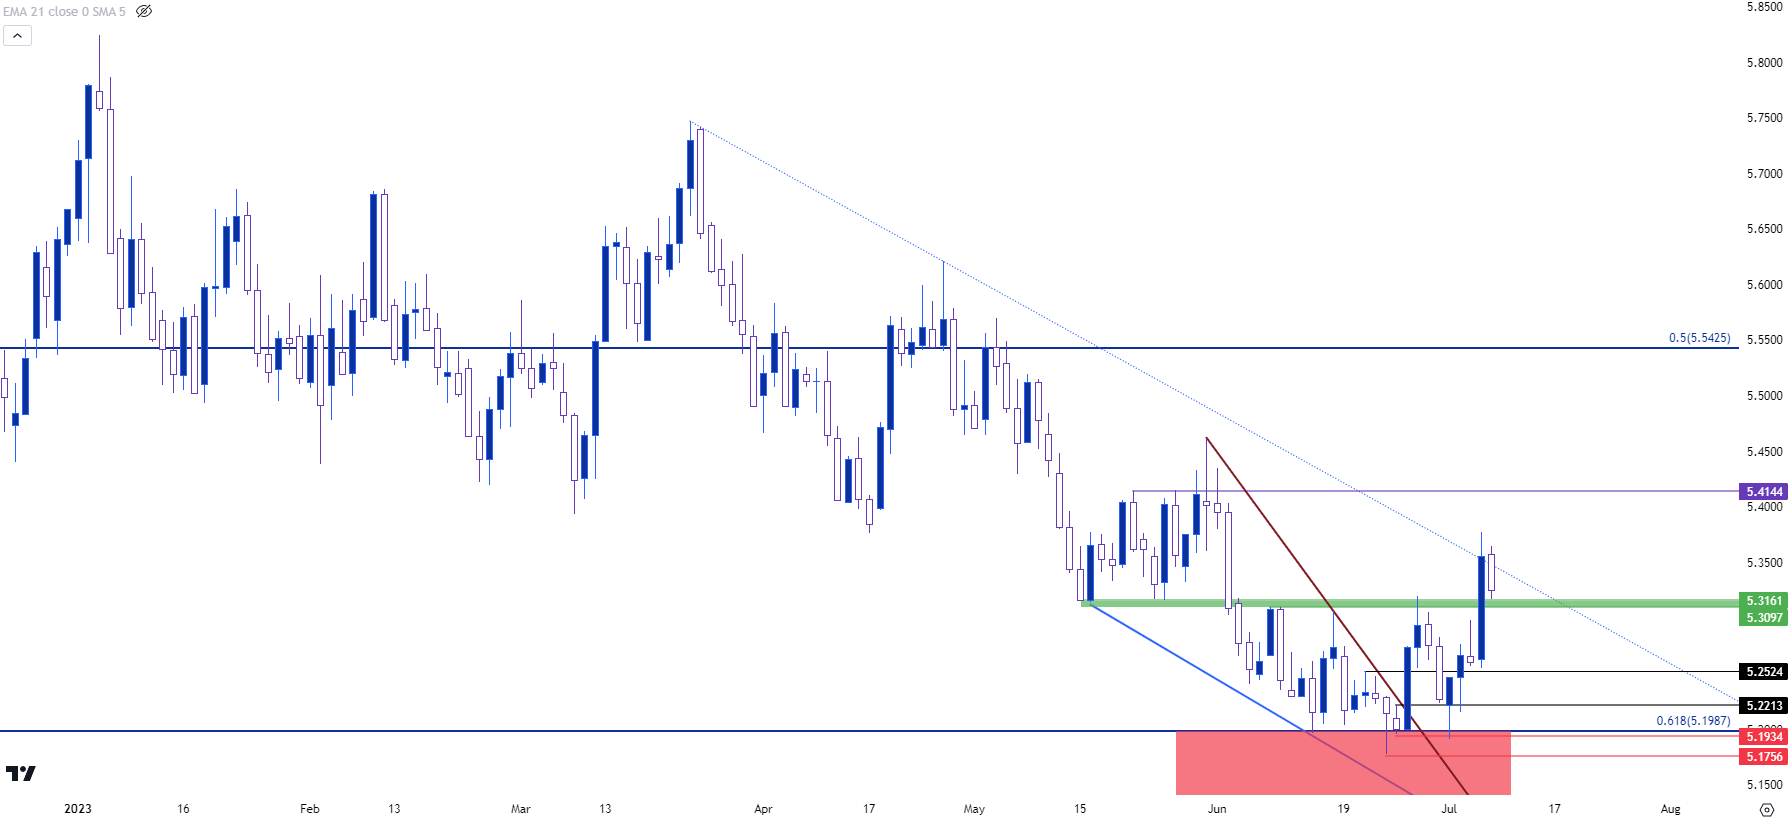
- EUR/BRL continued to show bullish price action after breaking above the falling wedge formation last week. This week, price set a fresh higher-high and has pulled back for a test of higher-low support at prior resistance.
- I’ll be discussing these themes in-depth in the weekly webinar on Tuesday at 1PM ET. It’s free for all to register: Click here to register.
The Brazilian Real opened the week with some considerable weakness. I had looked into the matter last week as rate cut bets were getting priced-in for Brazil, which had helped USD/BRL to print its first green weekly bar since late-May.
But, the US Dollar had issues of its own on Friday after the release of Non-farm Payrolls triggered a bearish run in the currency, which ended up erasing a large portion of that gain.
EUR/BRL, on the other hand, has filled in quite attractively for bulls. Over the past two weeks I’ve been highlighting a possible reversal setup in the EUR/BRL pair as a falling wedge formation had built.
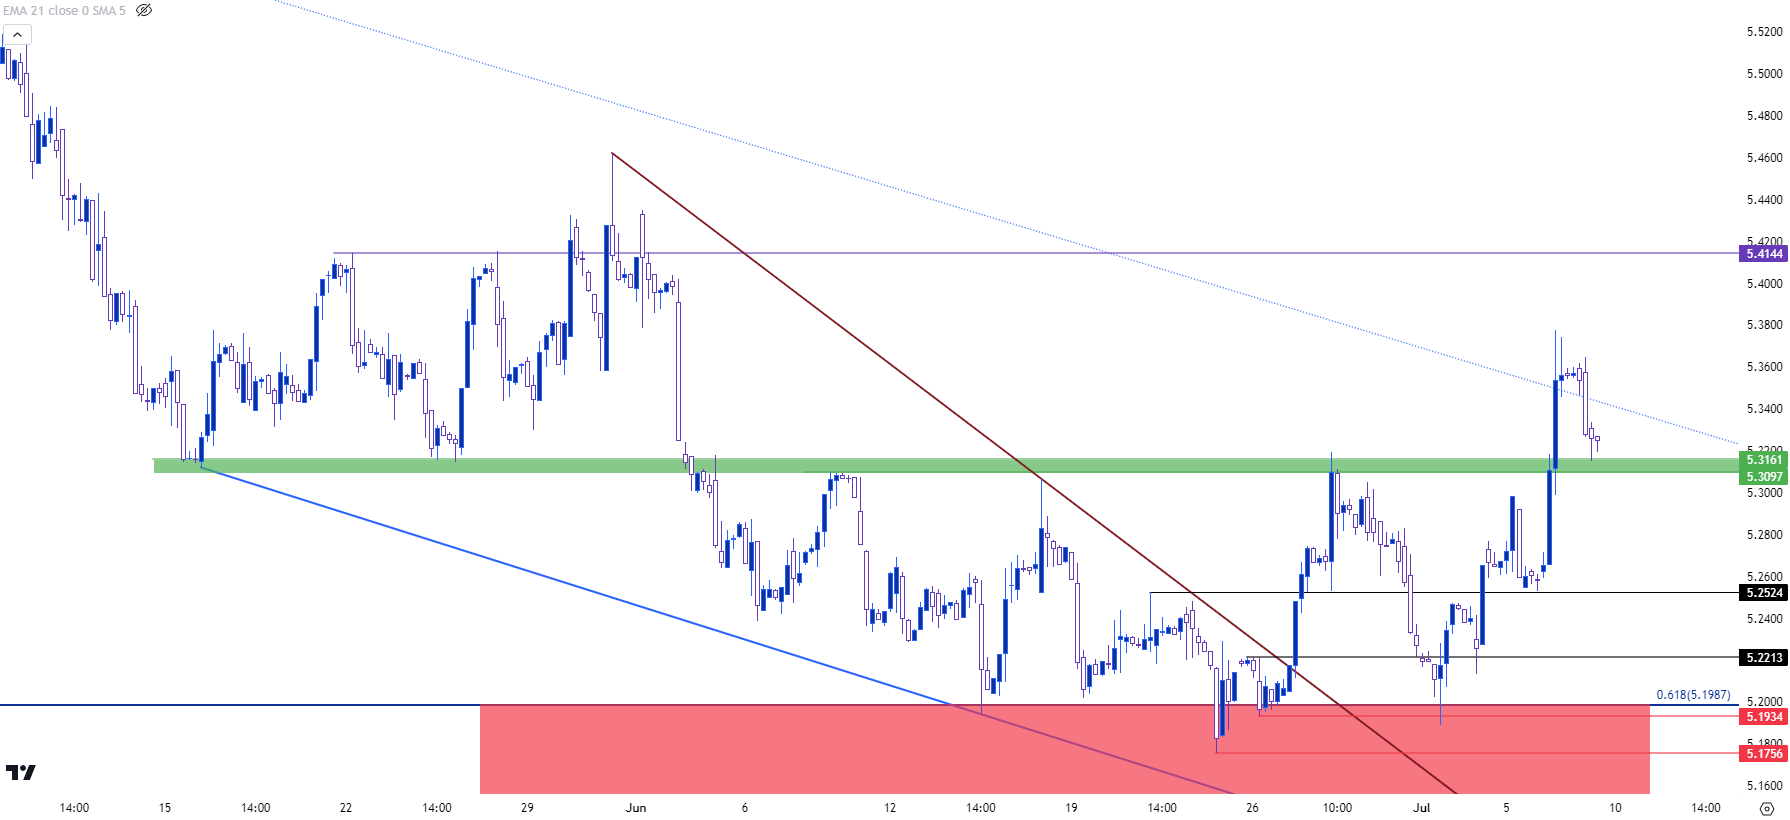
Two weeks ago, price in the pair tested a key point of support, but was unable to close below the Fibonacci level at 5.1987. Bulls forced the break a week later, but resistance held at a key spot on the chart around the 5.3100 level. This week saw bulls press the breakout beyond that level to a fresh monthly high, and the corresponding pullback has thus far held higher-low support at that prior spot of resistance, shown in green on the below chart.
EUR/BRL Daily Price Chart
 Chart prepared by James Stanley; EUR/BRL via Tradingview
EUR/BRL Shorter-Term
For Brazilian Real bears, EUR/BRL could continue to hold some attraction given that print of a fresh monthly high along with the potential for higher-low support. But – bulls will need to continue to hold the line and for that, they’re largely looking for a continued hawkish stance from the European Central Bank without a negative data item coming into the equation that causes market participants to re-think those rate hike expectations around the ECB.
EUR/BRL Four-Hour Chart
 Chart prepared by James Stanley; EUR/BRL via Tradingview
USD/BRL
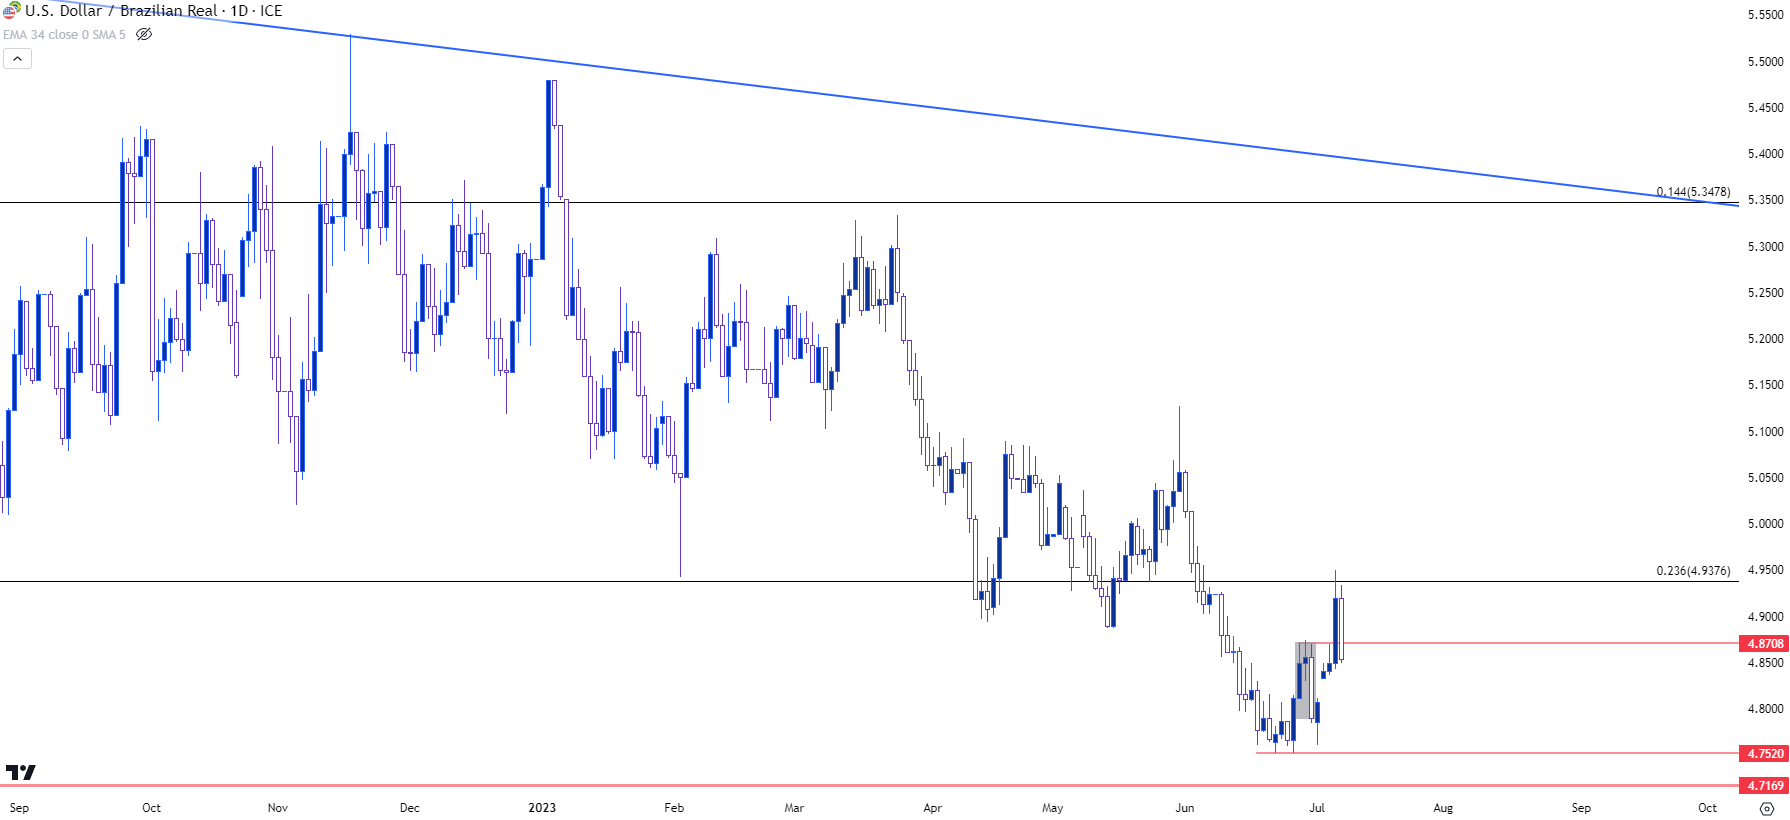
Last week I highlighted an evening star pattern in USD/BRL and that formation failed to continue, as bulls showed a strong response to start the week and ultimately helped to drive price up to the Fibonacci level at 4.9376. That level held the highs on Thursday but what happened on Friday brings question marks to the bullish theme as sellers erased most of the Thursday breakout.
USD/BRL Daily Price Chart
 Chart prepared by James Stanley; USD/BRL via Tradingview
USD/BRL Longer-Term
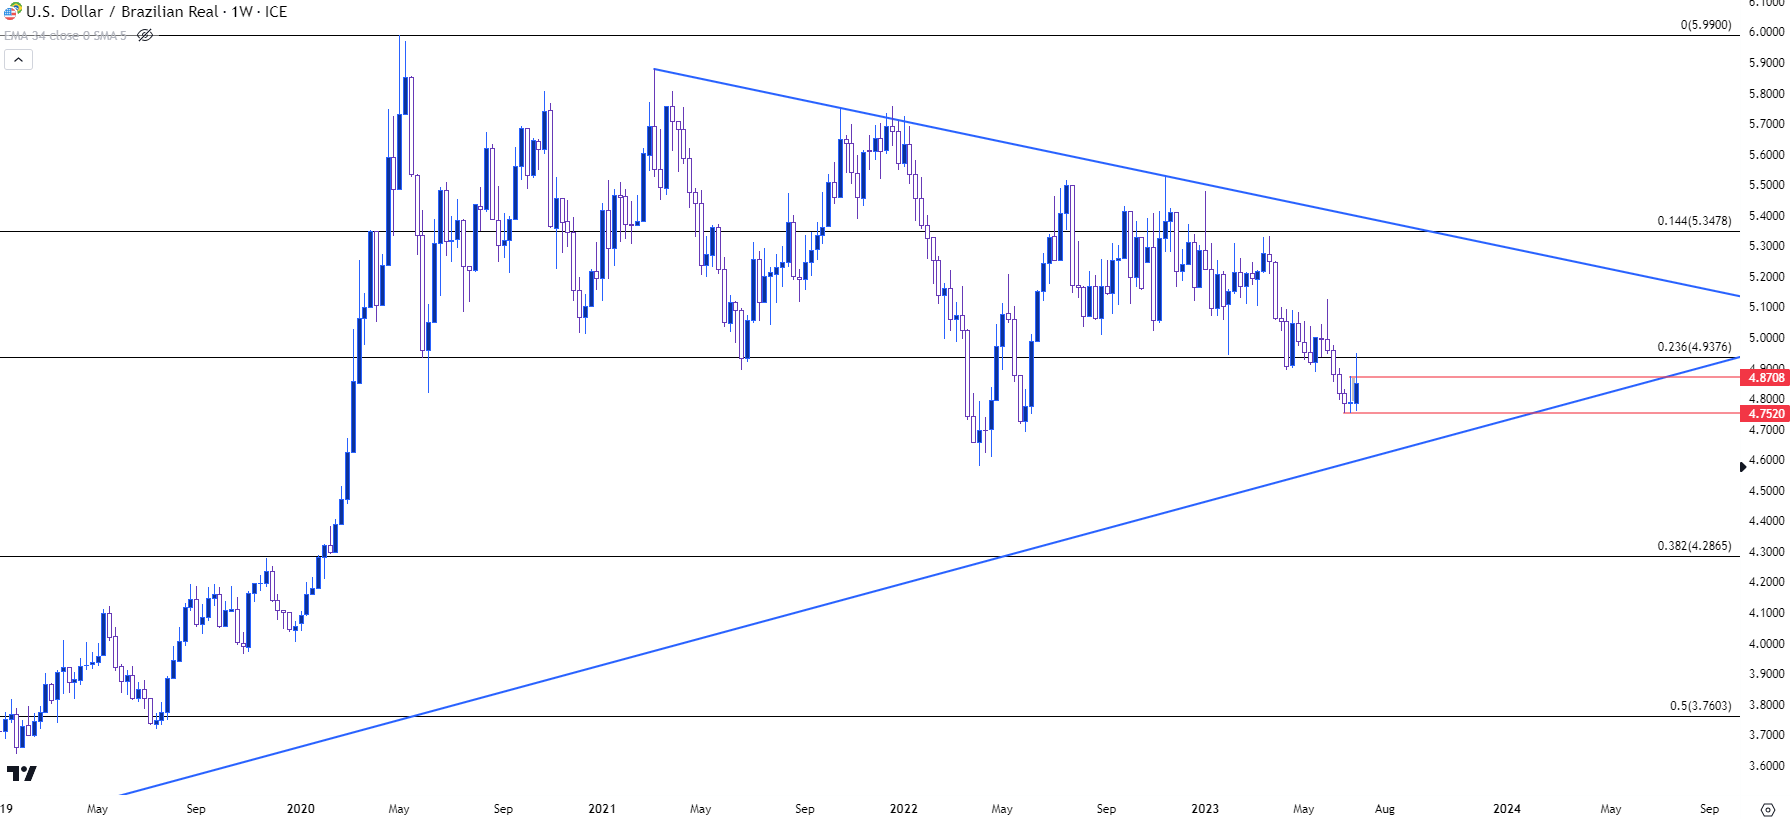
While near-term direction remains unclear, there remains potential for longer-term support around the 4.7520 level that I had looked at last week. That argument would still be relatively young as all that we’ve had was two weeks of support, combined with a hold above that level this week. But, if bulls can continue to defend that level there could possibly be the return of USD-strength. And given the monetary scenario, with Copom possibly nearing cuts while the Fed continues to talk up hikes, there could remain some fundamental motivation for such a scenario to develop.
USD/BRL Weekly Price Chart
 Chart prepared by James Stanley; USD/BRL via Tradingview
--- written by James Stanley, Senior Strategist


