Brazilian Real Talking Points:
- The Brazilian Real showed strength against USD this weak but weakness against EUR/BRL, as the falling wedge reversal continues to fill-in there.
- USD/BRL is now re-testing a key zone of longer-term support, and with Copom on the verge of rate cuts, this could make for a compelling reversal back drop, so long as this support can hold.
- I’ll be discussing these themes in-depth in the weekly webinar on Tuesday at 1PM ET. It’s free for all to register: Click here to register.
It was a mixed week for the Real, as weakness in the USD helped to drive USD/BRL back down to a key support zone; but EUR/BRL continued to work the bullish reversal theme that we’ve been discussing in these pieces over the past few weeks.
EUR/BRL had built a falling wedge formation in late June, which I had looked at in the technical forecast at the time. The Real had shown strength against both the USD and the Euro until that formation had come into play. At the time of that writing, the pair had just set a fresh 2023 low, but now a little less than a month later bulls have showed a few different pushes of higher-highs and higher-lows that builds the case for bullish continuation potential. A week later, the beginning stages of bullish reversal had shown, and then last week showed a pullback from a higher-high to test a higher-low right at a spot of prior resistance. Bulls have since pushed topside continuation since then.
The fact that Copom may be nearing rate cuts can certainly assist on the fundamental side of the matter, and from the technical backdrop, the pair held a key support test this week at the same level of prior resistance that’s been in-play of late. That price plots around the 5.31 level and it remains relevant into next week, as this is the spot that bulls need to hold to keep the sequence of higher-highs and higher-lows in place.
For next resistance, we have a familiar area around 5.41 that’s restrained bulls for a couple of months now. If that level can be taken out, the next major spot of resistance is around the Fibonacci level at 5.54, which is the 50% mark from the same study that helped to mark the low a month ago at the 61.8% retracement.
EUR/BRL Daily Price Chart
 Chart prepared by James Stanley; EUR/BRL via Tradingview
USD/BRL
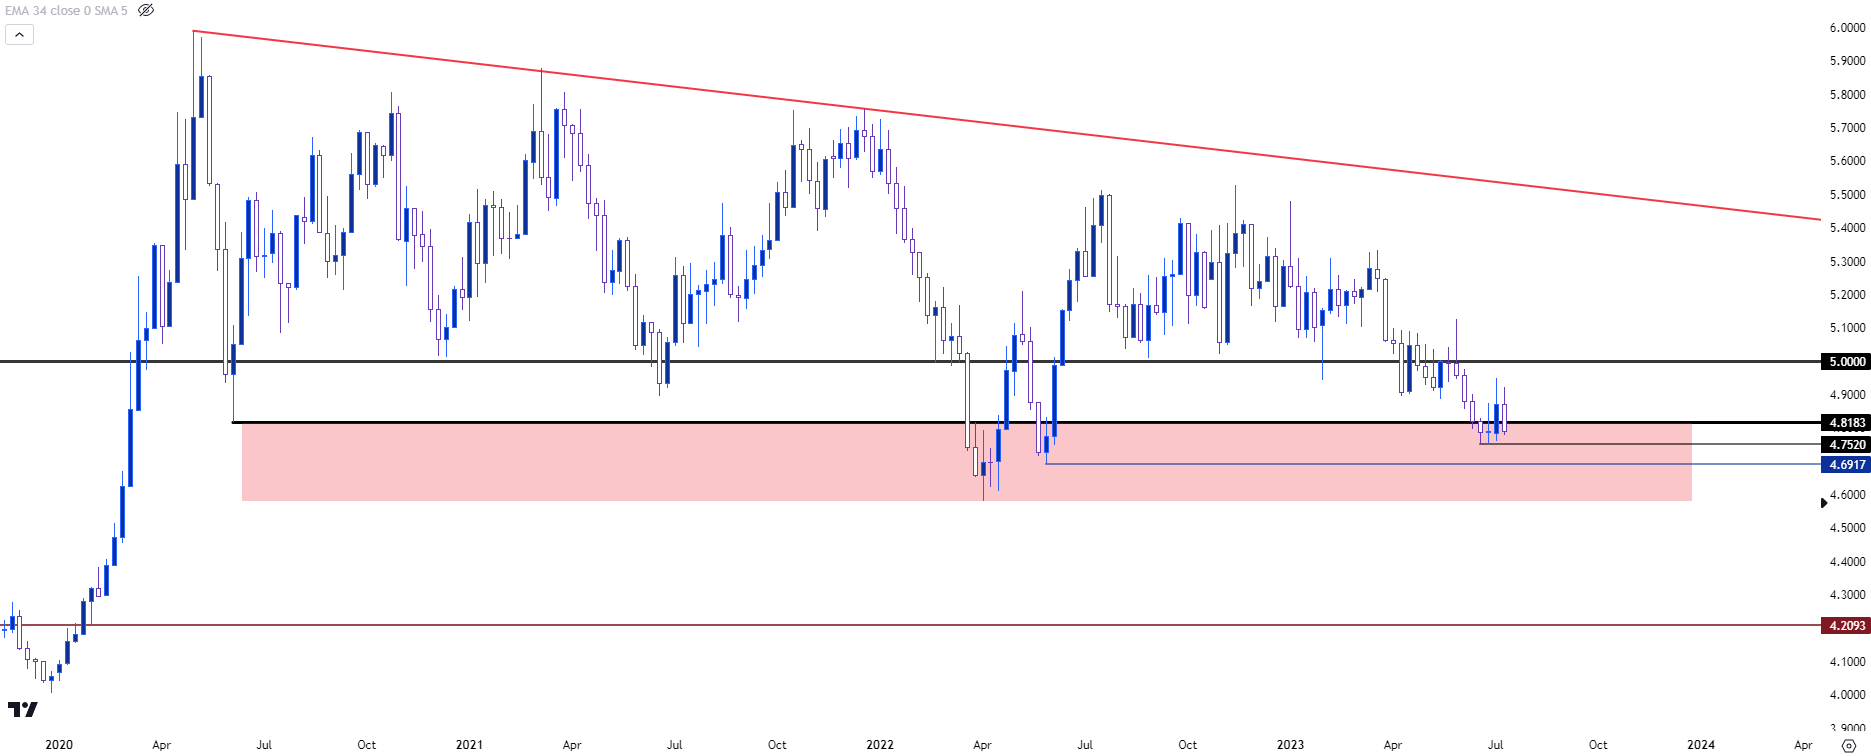
The US Dollar was beset by weakness this week which helped to establish highs or lows in many other major currency pairs. Not in USD/BRL, however, as price merely reverted back to a key zone of support, and with Copom expected to cut rates as the Fed continues to talk up another hike or two, this could keep the bearish trend restrained from a fundamental point of view.
More interesting, however, is the prospect of reversal potential given the return to a key support zone. That case would still be early, however, as all that we have is a possible hold of higher-low support as bears haven’t yet shown a willingness to test below 4.7520. Buyers will need to show a bit more force before that reversal case begins to take on attraction, but the potential is there if bulls can hold bears at bay near the yearly low that was established a few weeks ago.
USD/BRL Weekly Price Chart
 Chart prepared by James Stanley; USD/BRL via Tradingview
--- written by James Stanley, Senior Strategist


