Brazilian Real Talking Points:
- It was a strong week for the Real as Brazilian inflation picked up after the rate cut earlier this month, hitting hopes for more cuts from Copom.
- EUR/BRL snapped back from rate resistance and USD/BRL pulled back from last week’s breakout that found resistance at the 5.00 psychological level. This keeps the door open for synthetic EUR/USD scenarios around BRL with bullish USD/BRL and bearish EUR/BRL potential.
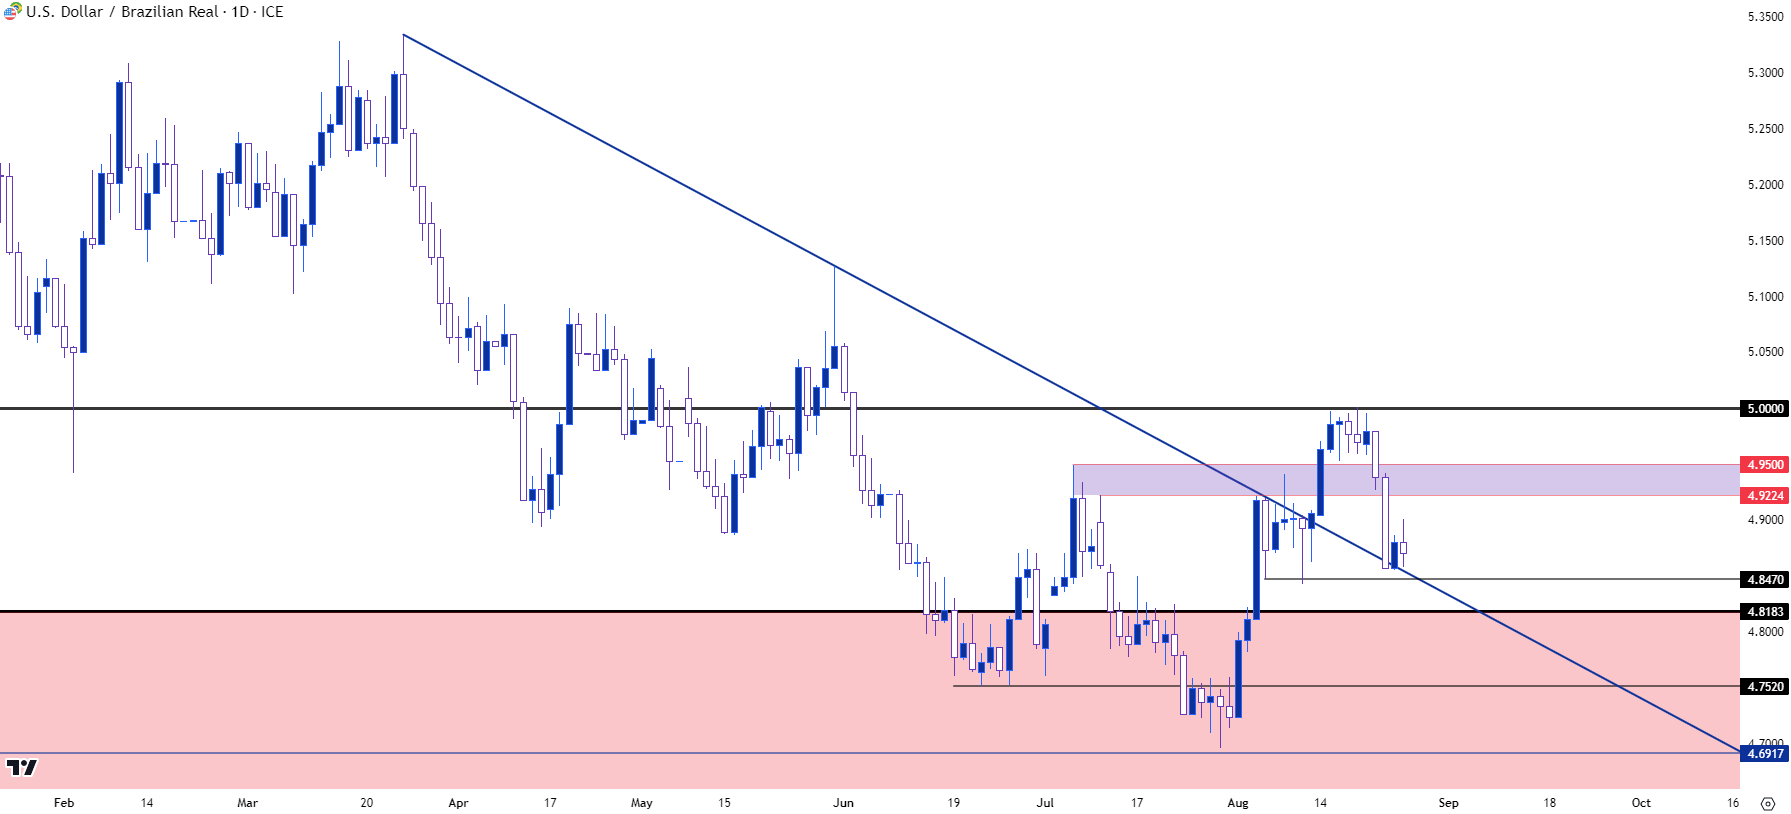
The breakout in USD/BRL has taken a step back this week. While there was building hopes for rate divergence between the US and Brazil, this week brought a strong inflation read out of Brazil that was somewhat of a setback to that theme. This dampened hopes for more near-term cuts out of Copom and this helped BRL to strengthen against the USD after last week’s breakout found resistance at the 5.00 handle.
At this stage, the trendline that had previously held resistance and was broken through last week is now showing up as support. This can keep the door open for bulls if price can remain above the 4.8470 swing low. This would keep open the possibility for a resistance revisit to the 4.9224-4.9500 zone, and if bulls can drive through that there’s a re-test at the 5.00 handle waiting.
For next week US data takes center stage as there’s Consumer Confidence (Tuesday), the Fed’s preferred inflation gauge of PCE (Thursday) and then Non-farm Payrolls on Friday.
USD/BRL Daily Price Chart

Chart prepared by James Stanley; USD/BRL via Tradingview
EUR/BRL
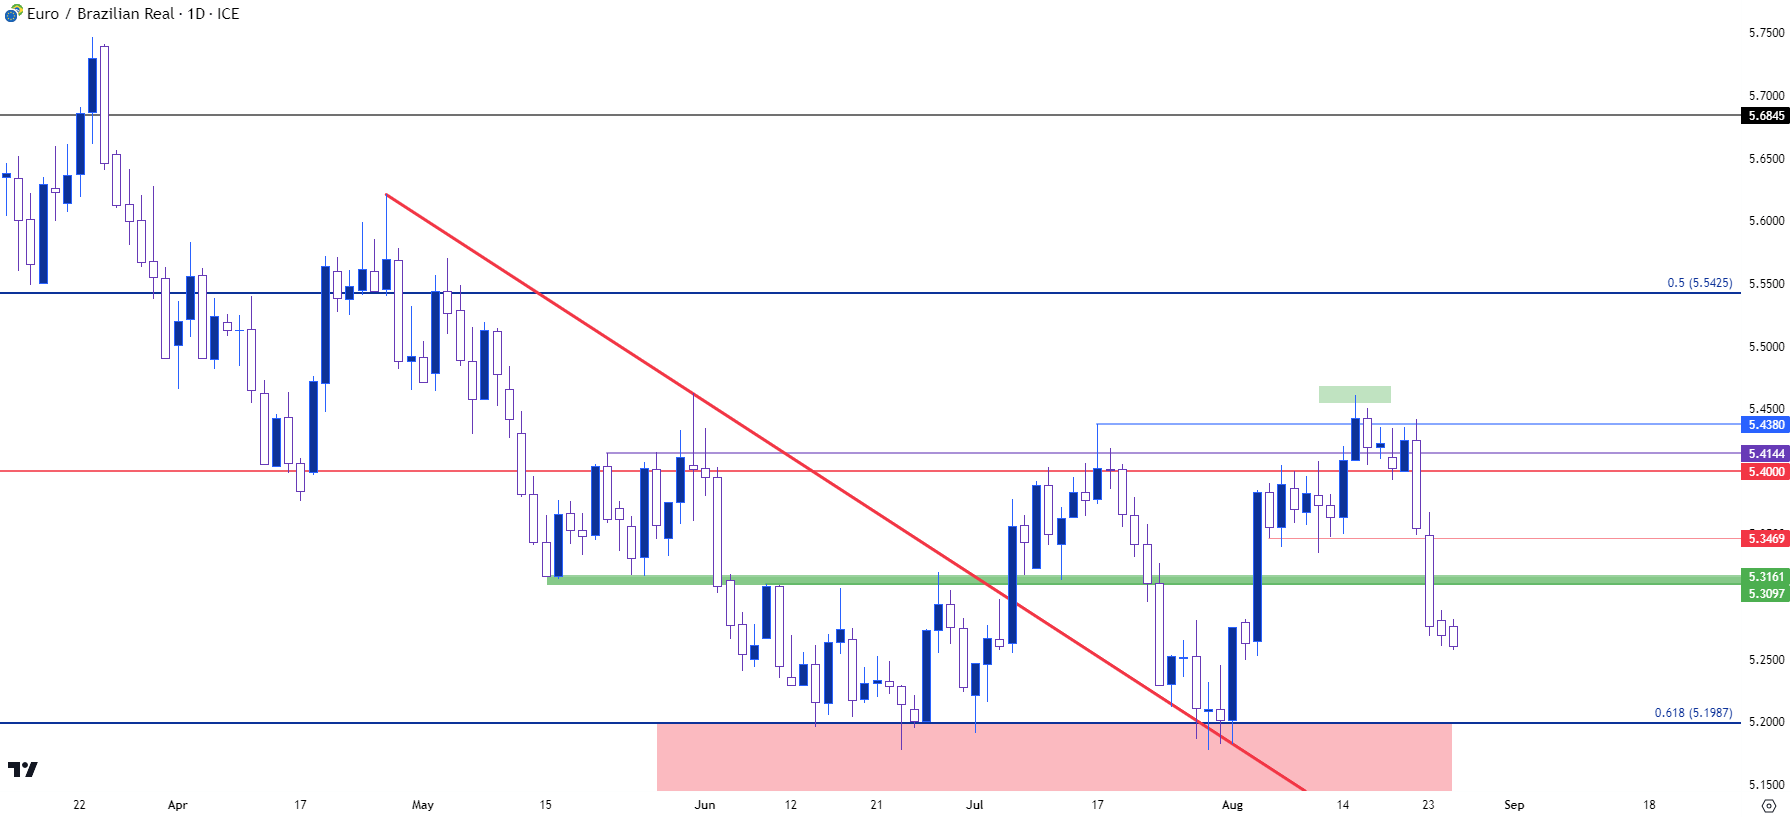
This week produced some noticeable change in EUR/BRL. Notably, the pair posted a bearish outside bar on Tuesday and continued with a heavy sell-off on Wednesday. This comes in stark contrast to the attempt to breakout in the prior week, and this chart highlights both diminished hopes of more hikes out of Europe to go along with a lower probability of more cuts out of Brazil.
From the technical perspective the pair retains range-bound tendencies, namely with a continued failure to drive above the 5.40 level along with what’s been strong adherence to support around the 5.20 Fibonacci level.
In between those two spots is a midline that was quickly traded through this week while the bearish engulf was building on Tuesday, but this can potentially serve as lower-high resistance for shorter-term bearish approaches, if it does come into play in the early portion of next week.
EUR/BRL Daily Price Chart

Chart prepared by James Stanley; EUR/BRL via Tradingview
--- written by James Stanley, Senior Strategist


