
British Pound Talking Points:
- GBP/USD came into the week with a full head of steam. But, as highlighted in the Tuesday webinar, the first test above 1.3000 since last July, coupled with an overbought RSI reading on the daily – led into a strong pullback in the latter portion of the week.
- GBP/JPY similarly experienced pain but that was mostly on Wednesday, with a pullback showing on Thursday and Friday.
- EUR/GBP broke down from a descending triangle in early-June and while there was continuation in the month following, last week showed a consistent streak of gains in the pair as EUR/GBP pulled back.
- I’ll be discussing these themes in-depth in the weekly webinar. It’s free for all to register: Click here to register.
The week started with optimism for bulls in GBP/USD and I had highlighted that bullish backdrop the week before. Price had started to form an inverse head-and-shoulders pattern in GBP/USD, with a very strong finish to the prior week.
The bigger issue in GBP/USD was longer-term in nature, as the pair was gearing up for its first re-test of the 1.3000 psychological level since July of last year and, at the time, RSI had pushed into overbought territory on the daily chart. I looked into this in the Tuesday webinar and after setting a high on Wednesday, the pair continued to pull back on Thursday and Friday, leaving the weekly chart with a bearish candle.
GBP/USD Weekly Price Chart
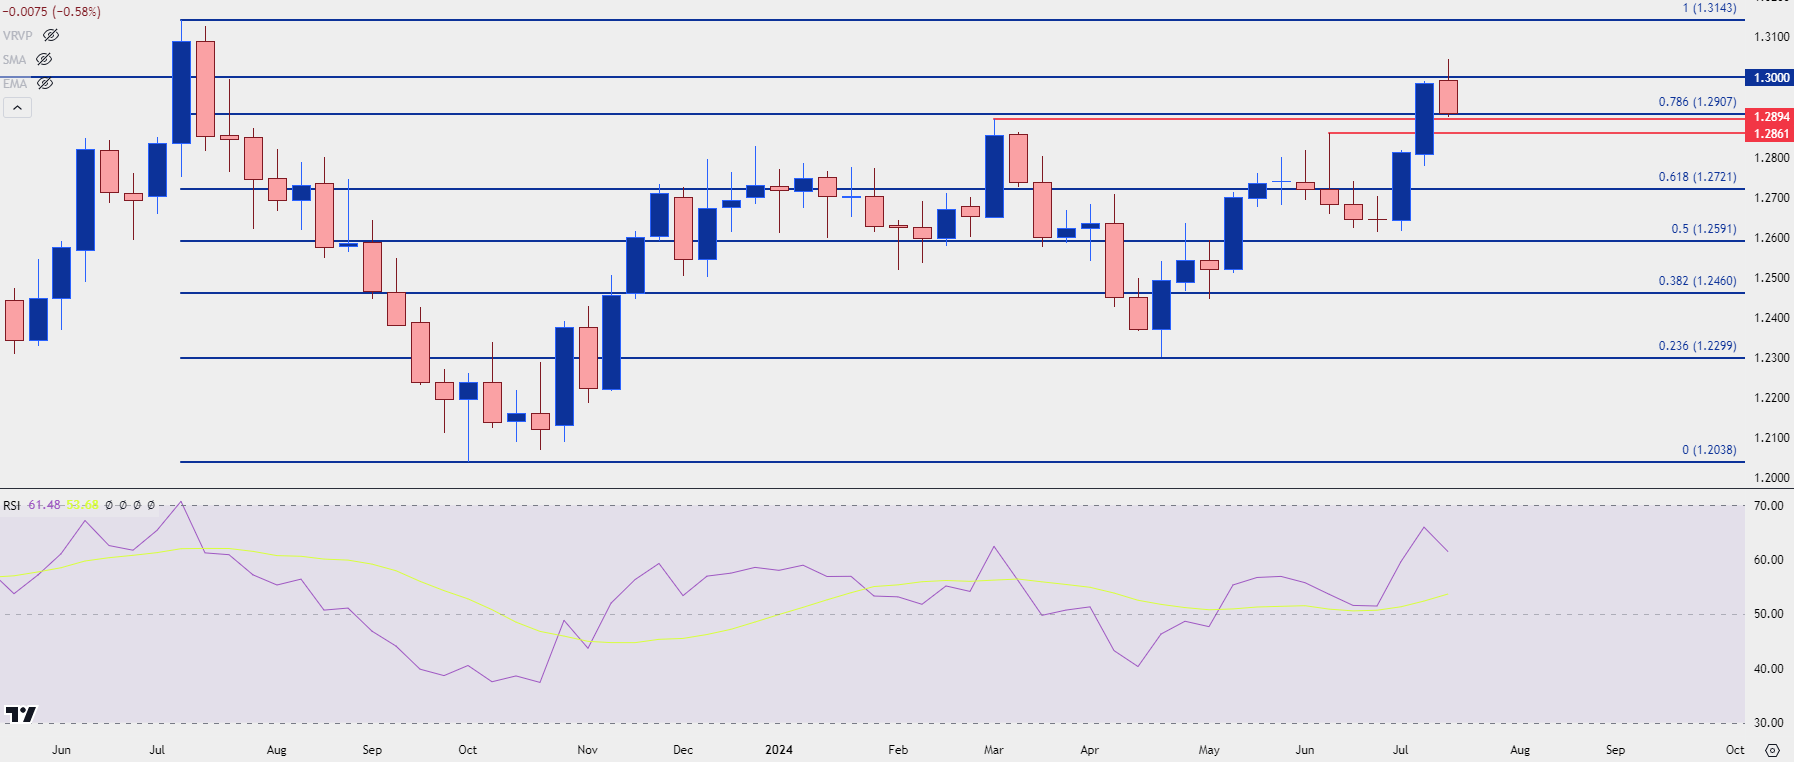 Chart prepared by James Stanley; data derived from Tradingview
GBP/USD Daily
From the daily chart, we can see some possible support coming into play as taken from the 78.6% Fibonacci retracement of the 2023 major move. There’s also a couple of nearby price swings of note, taken from 1.2894 and 1.2861. And now that RSI has left overbought territory, there could possibly be scope for bulls to go for a re-test of the 1.3000 psychological level.
The challenge, however, appears to be around the counter-part in GBP/USD of the US Dollar. The Greenback posed a brisk gain on Thursday and Friday and if that’s to continue, the sell-off in GBP/USD could deepen. This could perhaps expose the Fibonacci level at 1.2721 or the psychological level of 1.2750.
But, on a relative basis, if we do see USD-weakness come back, GBP/USD could be one of the more attractive majors to work with.
GBP/USD Daily Price Chart
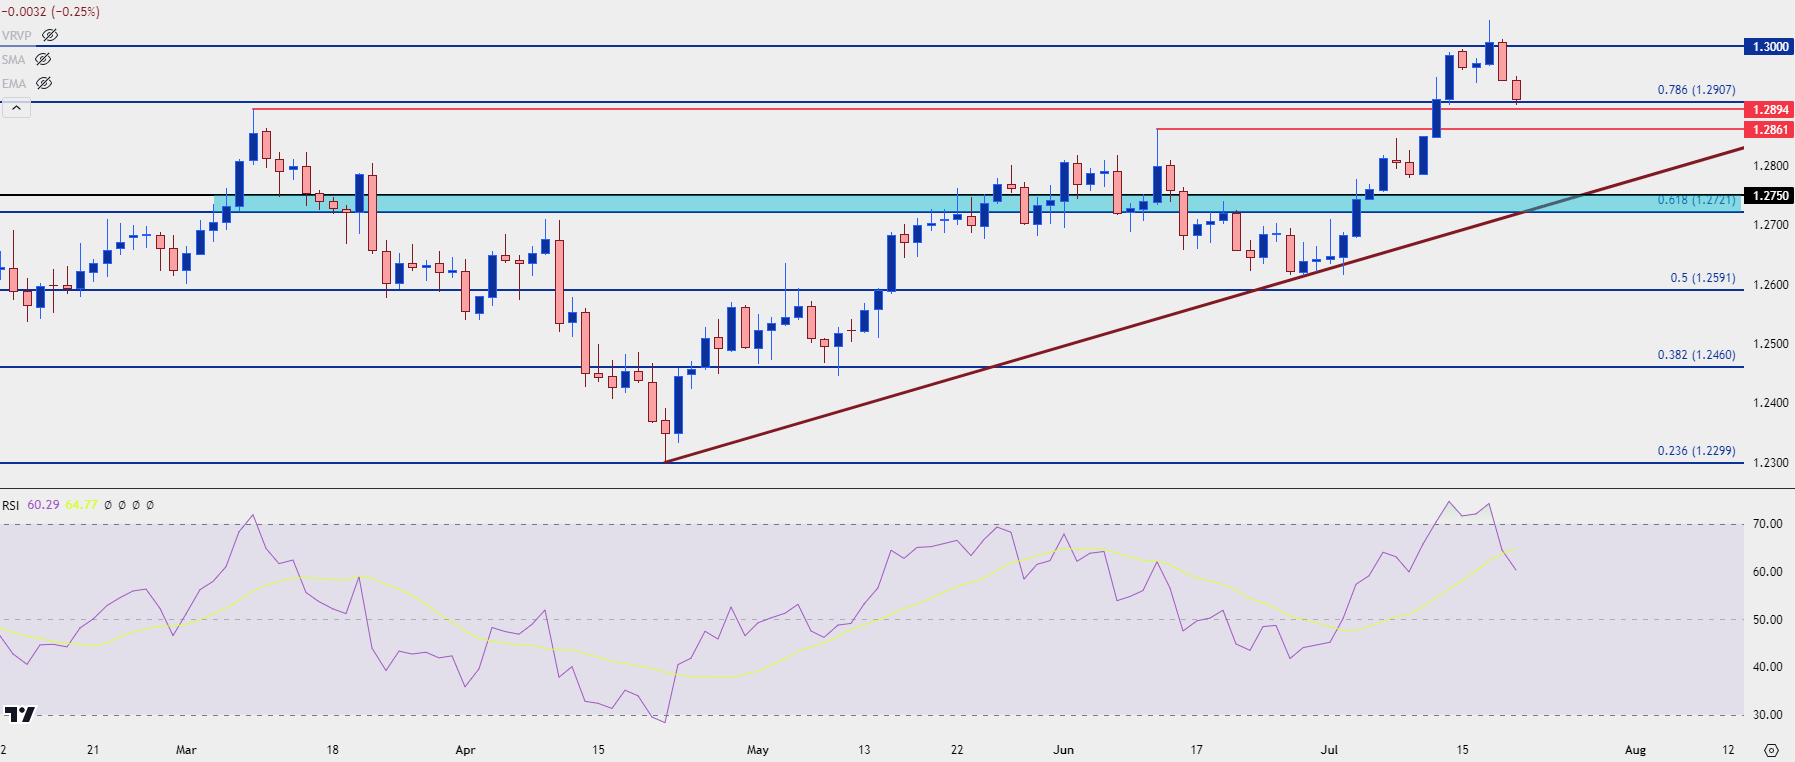 Chart prepared by James Stanley; data derived from Tradingview
GBP/JPY
The heavy hand of intervention continues to cast a shadow in GBP/JPY. Initially this week, price was holding a long a bullish trendline taken from May and mid-June swing lows. Prices had started to bounce in the early-portion of the week, but another aggressive push of Yen-strength on Wednesday saw sellers take out that trendline support while pushing down to a fresh Q3 low.
Given how consistent the grind-higher was ahead of the pullback, there’s not much for prior price structure to work from until we get down to the 200.55 level of prior resistance. And on Friday, we saw another example of resistance playing at a prior support level, taken from 204.21.
GBP/JPY Daily Price Chart
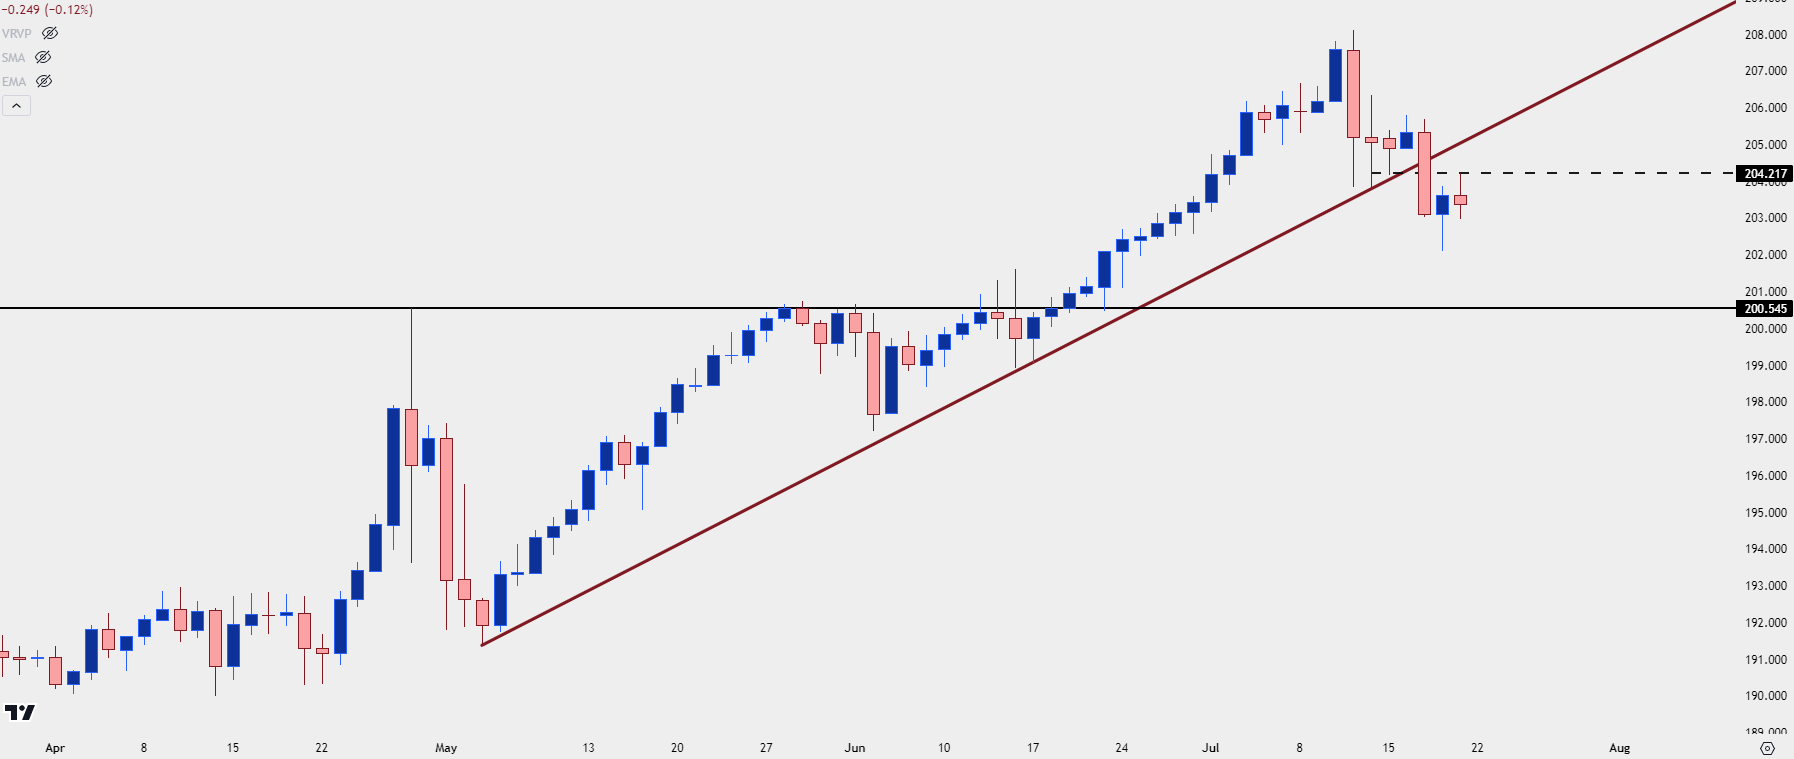 Chart prepared by James Stanley; data derived from Tradingview
GBP/JPY Shorter-Term
The four-hour chart of GBP/JPY doesn’t look as bad for bulls as the daily above. There can even be an argument made for a higher-high printing on Friday along with a possible higher-low as taken from the pullback from that prior support.
This brings on the premise of fundamentals as it was an intervention push that created the pullback and that’s likely played a role in last week’s price action.
The carry on the pair remains decisively-tiled to the long side and as we saw from above, GBP/USD was very strong in the early-portion of the week until 1.3000 came into play. So, if we do see Yen-weakness return which would be a likely scenario should the market not expect any additional interventions from the Bank of Japan, GBP/JPY can quickly become another point of attraction on the long side (or short side of JPY).
The key from the four-hour would be the continued build of higher-highs, so a topside breach of 204.22 would provide that higher-high, after which traders could look for a higher-low in effort of catching support in a bullish continuation scenario.
GBP/JPY Four-Hour Price Chart
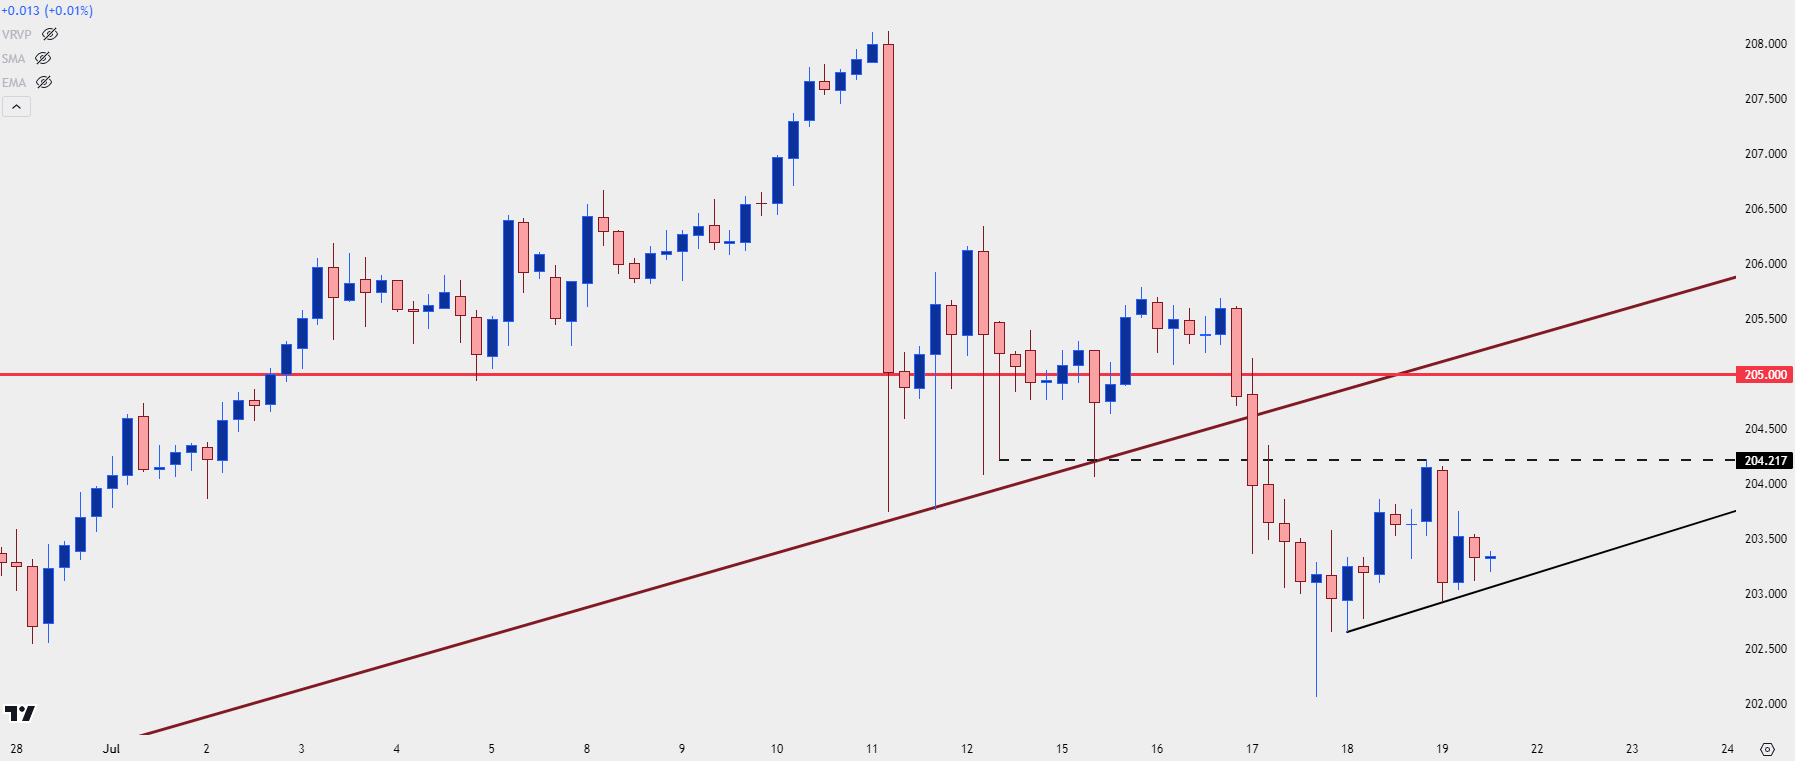 Chart prepared by James Stanley; data derived from Tradingview
EUR/GBP
When I had last looked at EUR/GBP in these forecasts, the pair was setting up with a descending triangle formation. But, the fact that the pair had been aggressively range-bound with a lack of volatility in early-2024 trade.
Support for the triangle was showing at the .8500 level, and after a bit of tangle, bears were able to force a lower-low a couple of weeks later. The initial run of the breakout was clean, and a corresponding pullback found support at prior resistance of .8500 which led to another fresh low in the pair.
EUR/GBP Weekly Price Chart
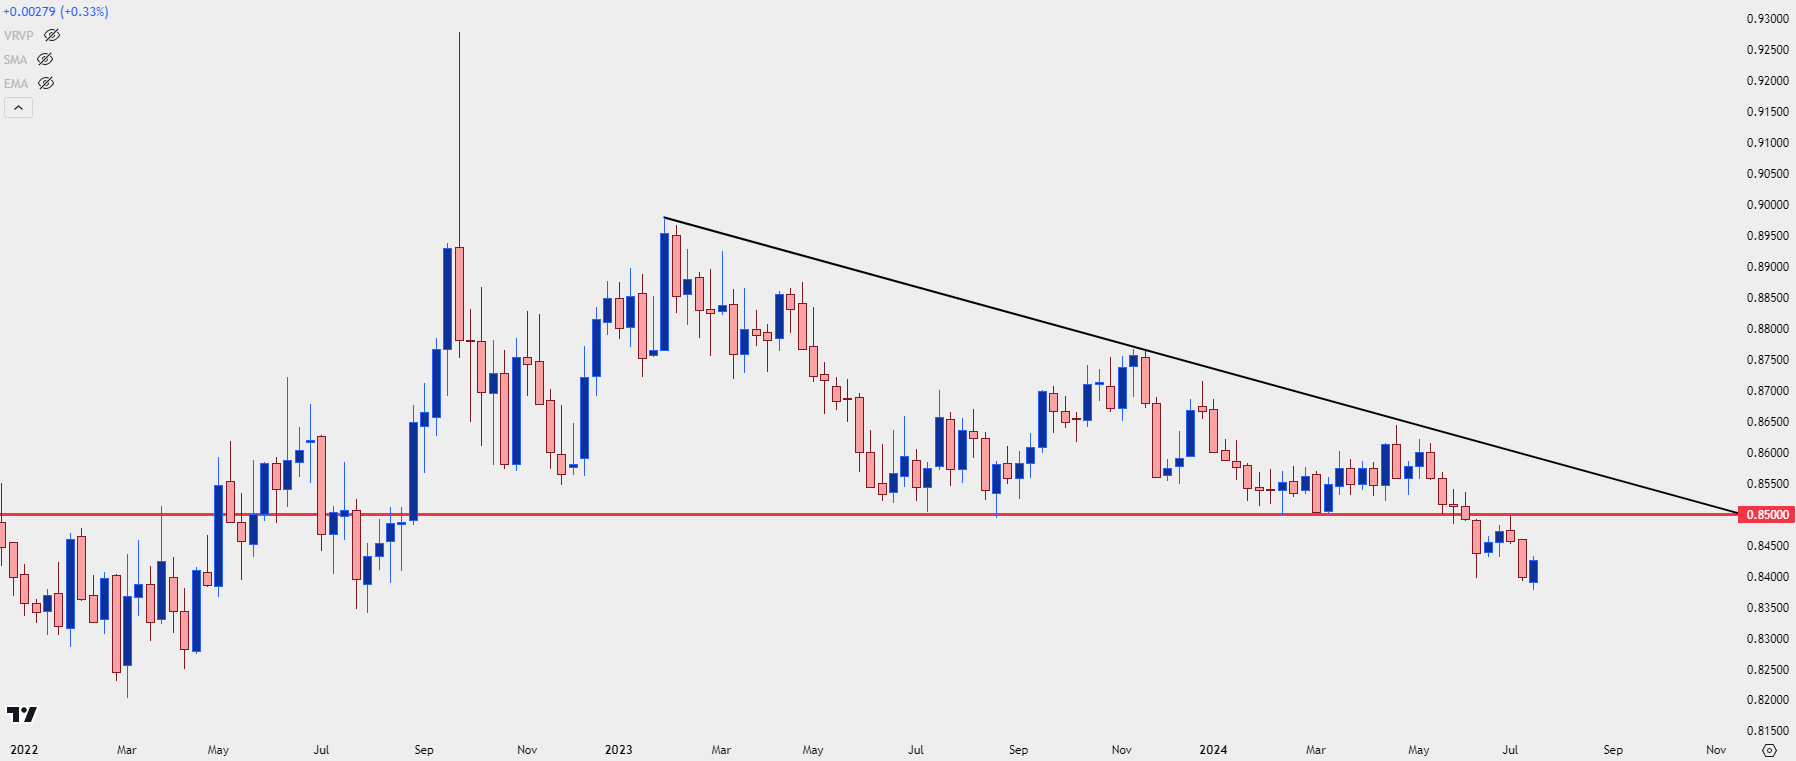 Chart prepared by James Stanley; data derived from Tradingview
EUR/GBP Shorter-Term
The week started with a fresh yearly low, but sellers couldn’t get very far after that. But – taking a step back highlights a continued progression of lower-lows and highs, with the most recent longer-term lower-high showing at that .8500 test in early-July. This keeps the door open for bears, but the key is going to be the re-emergence of bearish price action which is a difficult argument to muster after three consecutive green daily bars.
There’s a spot of possible resistance a little higher, around the 50% mark of the July sell-off. That plots around a group of prior swing lows so there’s an element of confluence at play there. If that doesn’t hold, there’s another spot of resistance around the 61.8% retracement of the same Fibonacci setup and that plots at .8453.
EUR/GBP Daily Price Chart
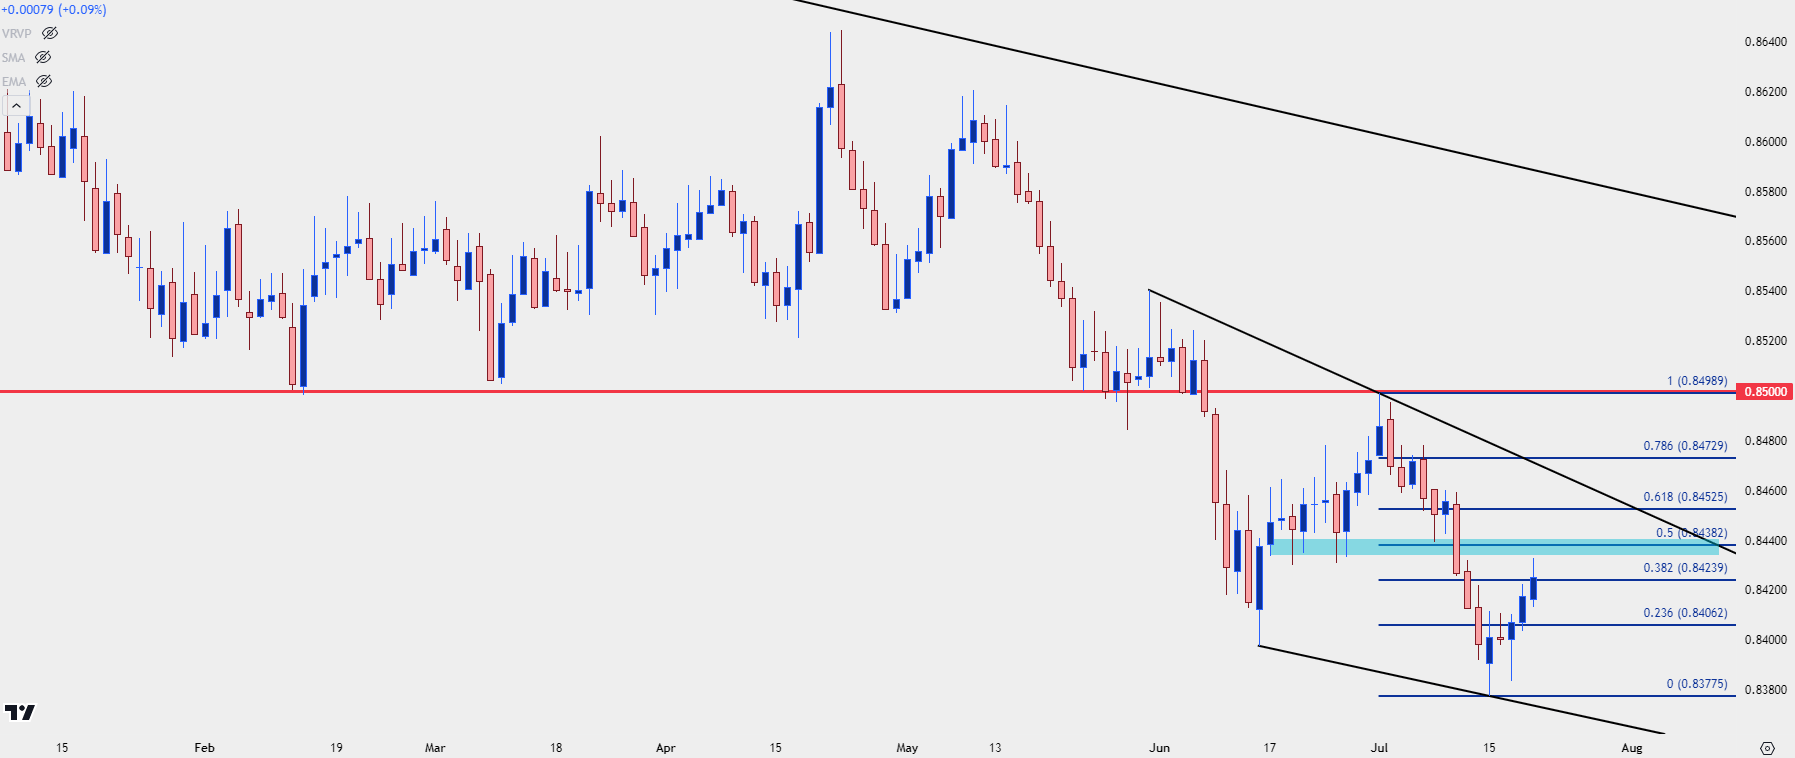 Chart prepared by James Stanley; data derived from Tradingview
--- written by James Stanley, Senior Strategist


