British Pound technical forecast: GBP/USD weekly trade levels
- British Pound holds December highs- reverses back into downtrend support
- GBP/USD threat remains for further losses medium-term
- Sterling resistance ~1.2156, 1.2448, 1.2773– support 1.1783-1.1841, 1.1632/44 (key),
The British Pound plunged more than 4.2% off the January highs with GBP/USD now approaching initial trend support near the yearly low. While an outside-weekly reversal suggests some downside exhaustion here, Sterling remains vulnerable to a deeper correction while below this week’s high. These are the updated targets and invalidation levels that matter on the GBP/USD weekly technical chart.
Discuss this GBP/USD setup and more in the Weekly Strategy Webinars beginning February 27th.
British Pound Price Chart – GBP/USD Weekly

Chart Prepared by Michael Boutros, Sr. Technical Strategist; GBP/USD on TradingView
Technical Outlook: The British Pound has been trading within the January range since the start of the month with a reversal off Fibonacci resistance at 1.2448 taking GBP/USD back into downtrend support.
The focus is on a possible reaction off a key technical confluence at 1.1783-1.1841- a region defined by the 100% extension of the recent decline and the objective 2023 opening-range low. Ultimately, a break / weekly close below the 2020 low-week close / 38.2% retracement at 1.1632/44 is needed to mark resumption of the broader downtrend.
Initial resistance stands with the 52-week moving average (currently ~1.2156) with a breach above the yearly highs exposing pitchfork resistance around the February 2019 low at ~1.2773- an area of interest for possible exhaustion / price inflection IF reached.
British Pound Price Chart – GBP/USD Weekly (2009 Price Parallel)

Chart Prepared by Michael Boutros, Sr. Technical Strategist; GBP/USD on TradingView
A parallel of the 2009 rally (pink) suggests a period of consolidation here into these support zones before a larger correction lower. For context, Sterling remained rangebound for nearly 230 days before breaking decisively – the current GBP/USD range is roughly 90-days in.
Bottom line: The British Pound remains vulnerable to further losses but is quickly approaching initial support levels near the January low. From at trading standpoint, look to reduce portions of short-exposure / lower protective stops on a stretch towards 1.1640. Rallies should be capped by this week’s high IF price is heading lower. I’ll publish an updated British Pound short-term outlook once we get further clarity on the near-term GBP/USD technical trade levels.
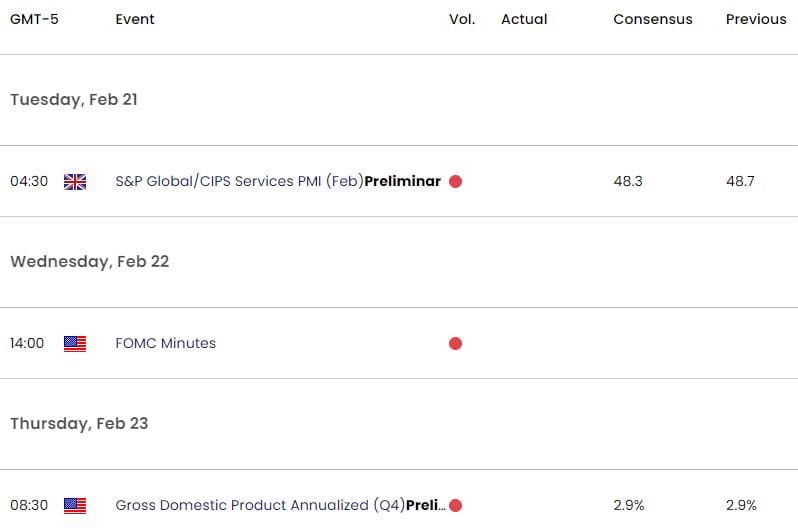
Key Economic Data Releases

Economic Calendar - latest economic developments and upcoming event risk.
Active Weekly Technical Charts
- Australian Dollar (AUD/USD)
- Japanese Yen (USD/JPY)
- Canadian Dollar (USD/CAD)
- Euro (EUR/USD)
- Gold (XAU/USD)
--- Written by Michael Boutros, Sr Technical Strategist with FOREX.com
Follow Michael on Twitter @MBForex


