GBP/USD, British Pound, US Dollar Talking Points:
- After a sluggish three-month stretch for GBP/USD, bulls have returned in November to push the strongest monthly outing in the pair since last November.
- GBP/USD ran into a confluent zone of resistance on Tuesday and the bullish trend has since started to turn. This raises the question of trend trajectory which I’ll explore below with three different chart time frames.
- I’ll be discussing these themes in-depth in the weekly webinar. It’s free for all to register: Click here to register.
It’s been a blistering month of November for GBP/USD as the pair finally started to show some strength after a sluggish three-month stretch. The trend has started to show more prominently over the past week. But, to get the proper perspective, we really need to draw back to last September. This is when the British Pound was showing crash-like conditions after the unveil of a budget plan that soon led to the ouster of Liz Truss. September 26th of last year was a chaotic day for UK markets, and the GBP set a fresh 37-year low against the US Dollar, challenging levels that hadn’t been traded since well before George Soros ‘broke’ the Bank of England. The last time GBP/USD traded at those levels was just ahead of the Plaza Accord in 1985, which reset the tables dramatically.
The panic soon began to subside and that led into a strong Q4 to finish 2022 trade, and that strength largely remained into July of this year. That’s when the US Dollar bullish trend re-appeared and many FX majors folded in response, GBP/USD included. But that trend that started from the 37-year lows last year is notable and may have some continued importance in the market.
GBP/USD Monthly Price Chart
 Chart prepared by James Stanley, GBP/USD on Tradingview
GBP/USD Intermediate-Term
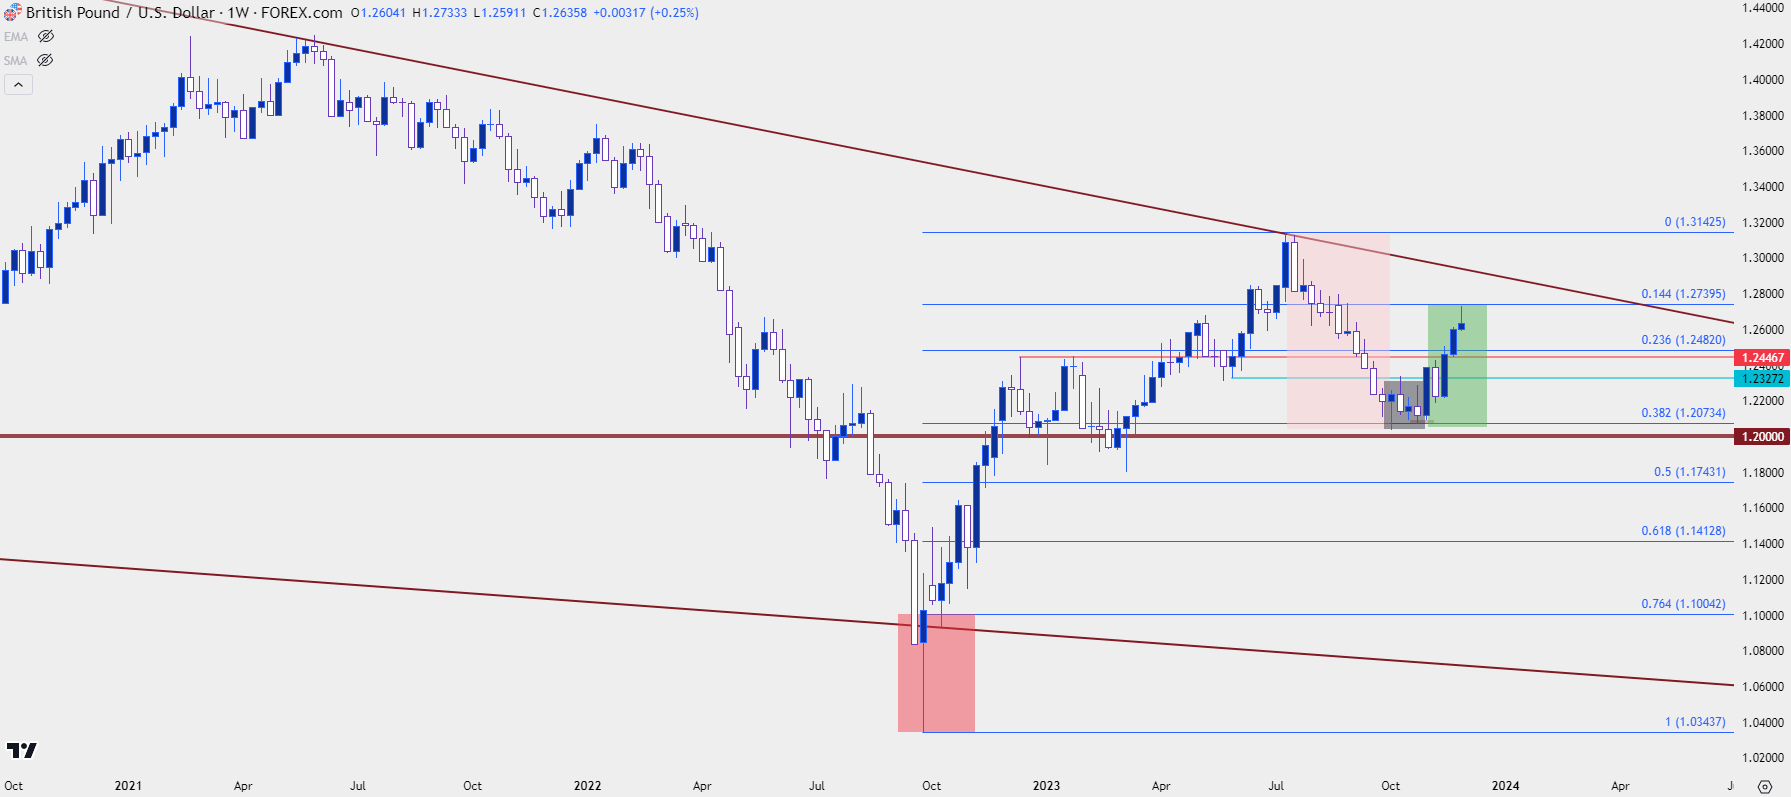
The reversal from the flash crash lows came on quickly as the pair gained as much as 2,100 pips from the September low to the December highs. And bulls weren’t ready to relent, as a build of support developed at the 1.2000 level that soon led to topside trend continuation. Buyers largely remained in-control for much of the first half of the year, eventually pushing up to a fresh yearly high at 1.3143 in July.
But that’s around the time that US Dollar strength began to re-appear. Few majors were able to avoid the onslaught of USD bulls and given deviation in economic data between the US and Europe and the UK, there was some fundamental drive to support that thesis.
USD strength ran for a clean 11-week pattern before beginning to stall in October, after which bears came back in November after the release of CPI data. This had some similarities to last year when a similar backdrop had appeared in the USD and this could have bearing for major currency pairs as well. I’ve been tracking this somewhat closely in EUR/USD but as I shared in this week’s webinar, there could be a case to be made for GBP/USD being a cleaner manifestation of those USD trends, particularly with EUR/USD battling the 1.1000 handle.
From the weekly chart, we can see these dynamics playing out clearly, with sellers showing up in July and pushing a clean 38.2% Fibonacci retracement of the prior bullish move that started last year. That brought on a build of support at 1.2073, with buyers continuing to show defense above the 1.2000 level.
This kept price holding near support as we came into November trade, with the FOMC rate decision on the first day of the month.
GBP/USD Weekly Price Chart
 Chart prepared by James Stanley, GBP/USD on Tradingview
GBP/USD Shorter-Term
In the opening of November, we had the FOMC rate decision, but we also had a Super Thursday from the Bank of England, and along the way a pullback developed in the US Dollar that helped to lift many major pairs, GBP/USD included.
That trend has been powerful through the month of November, with morning stars developing along the way that helped to keep the door open for continuation. This ran all the way into yesterday morning, at which point price began re-test of another key zone of resistance that spans from 1.2720-1.2758. That has since held the highs and after a doji printed yesterday, we have downside continuation so far today.
That trend has been red hot and there’s been a minimum of pullback this month, particularly over the past week. So, this becomes an ideal scenario to see how aggressive bulls remain to be. There’s support potential at 1.2590, 1.2548 and then the 1.2500 psychological level.
Given the hold of resistance at a key spot, combined with the doji on yesterday’s daily chart, a continued push from sellers could create an evening star formation. Also of interest, however, is the fact that RSI on the daily chart had moved into overbought territory and the indicator has pushed back-below the 70 level, which could give bears a bit more motivation in looking for a deeper pullback move.
In that event the 1.2500 level becomes a major spot, much like 1.2000 was in October as bulls continued to defend that price before pushing a topside trend in November.
GBP/USD Daily Chart
 Chart prepared by James Stanley, GBP/USD on Tradingview
--- written by James Stanley, Senior Strategist


