
British Pound Talking Points:
- Tomorrow brings a Bank of England rate decision along with the expectation for another 25 basis points of tightening.
- Earlier today brought the release of UK CPI numbers and both core and headline CPI came in below expectation, which led to another push of GBP weakness. GBP/USD had started to bounce from a longer-term trendline, but that bounce was largely erased during the FOMC’s hawkish pause.
- I’ll be discussing these themes in-depth in the weekly webinar on Tuesday at 1PM ET. It’s free for all to register: Click here to register.
UK core inflation showed a drastic drop this morning, printing at 6.2% against a forecast of 6.8% and a prior print of 6.9%. Headline inflation showed a similar decline, albeit more moderate than core, with a 6.7% headline CPI print against an expectation for 7.0% and a prior print of 6.8%. That brought a run of weakness to the British Pound that brought in key supports in both GBP/JPY and GBP/USD. But the big event remained on the calendar for about 12 hours after that CPI release with the September FOMC rate decision.
The Fed didn’t hike but they did retain a somewhat hawkish stance via their projections and the net move so far has been a move of USD-strength. This has helped GBP/USD to push right back down to that support that had come into play earlier in the session.
This sets the stage for tomorrow’s Bank of England rate decision. The bank is expected to hike rates to 5.5% from 5.25% but as has become customary of late, the bigger question is what they might see down-the-road.
In GBP/USD from the weekly chart, we can see that support in-place around the 1.2348 swing, which was a spot of resistance in March that became support in May. There’s also a trendline projection in here as taken from the May 2021 and January 2022 swing highs. That trendline held the highs in May of this year and we’re now seeing the first semblance of a support test at that spot of prior resistance.
GBP/USD Weekly Price Chart
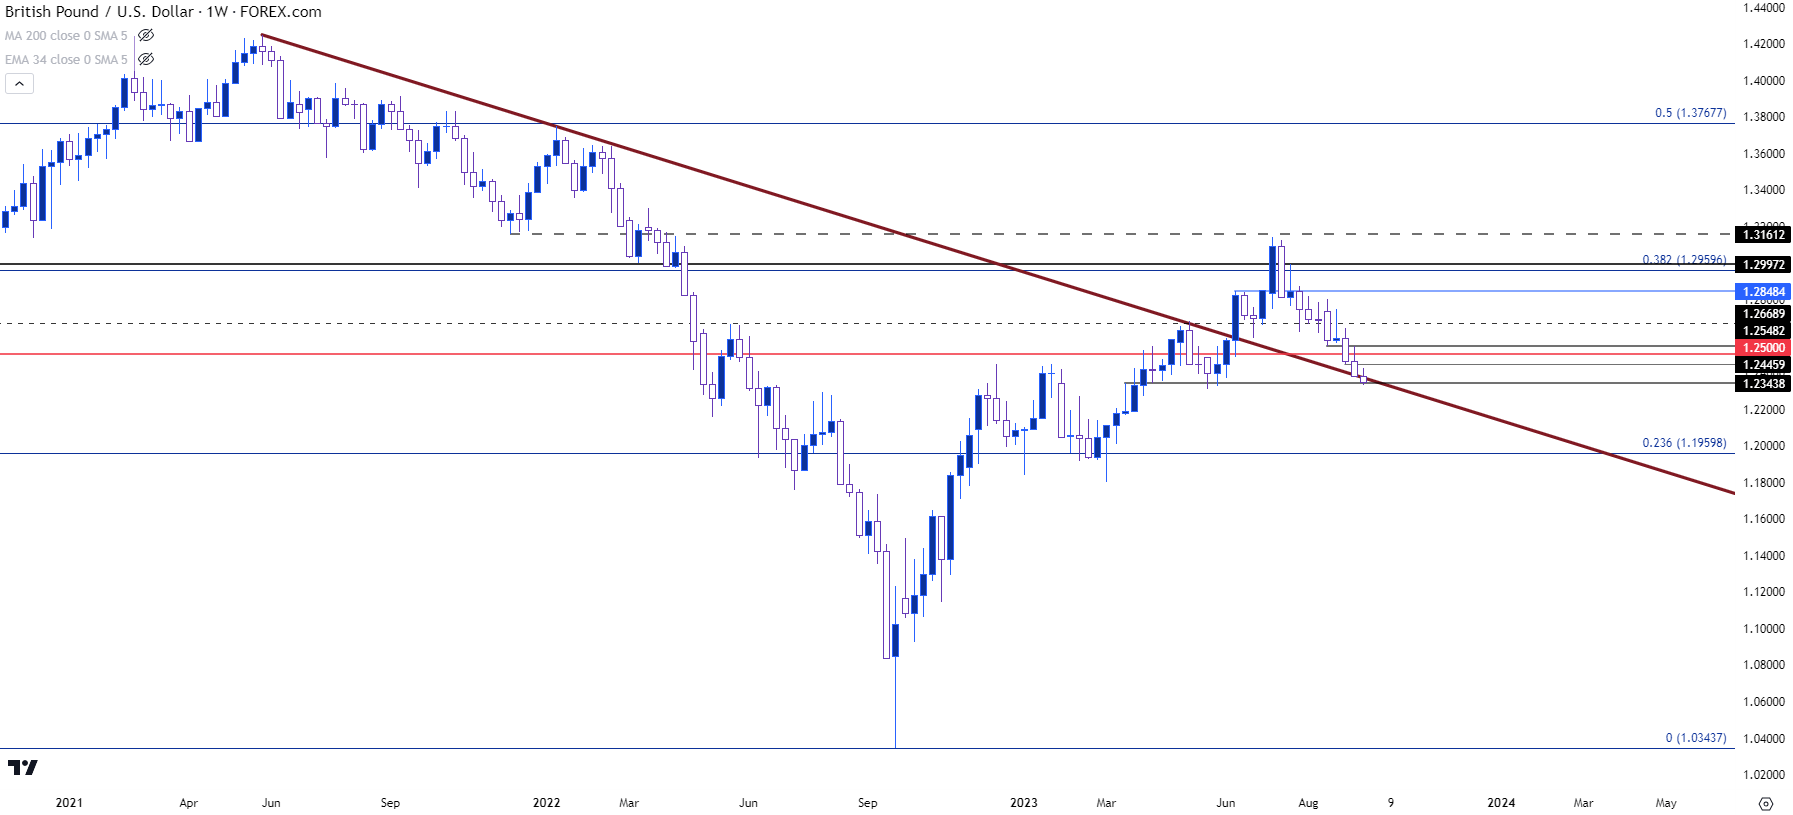
Chart prepared by James Stanley, GBP/USD on Tradingview
GBP/USD
Going down to the four-hour chart shows price testing that support as of this writing. There’s also resistance potential sitting overhead, around 1.2397, 1.2446, 1.2500 and then 1.2548.
GBP/USD Four-Hour Chart
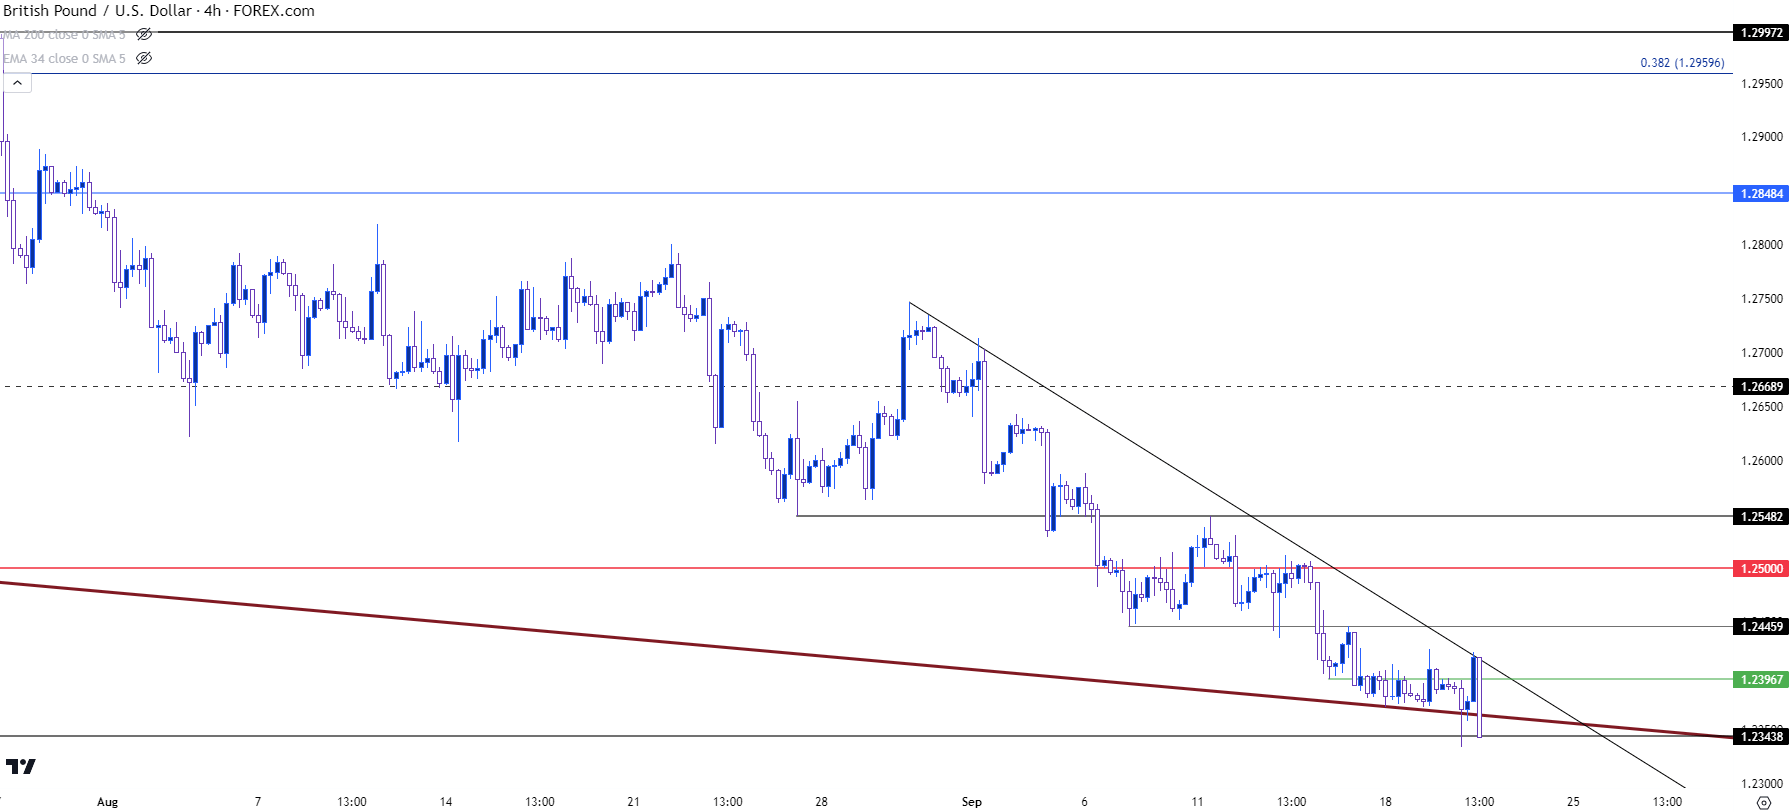
Chart prepared by James Stanley, GBP/USD on Tradingview
Going down to the daily highlights a falling wedge formation that’s formed over the past few weeks and much of September trade. This keeps the door option for reversal potential, although that door may be closing and tomorrow’s Bank of England rate decision will likely have something to do with that.
If bears can break through current support, that would invalidate the formation while also opening the door for tests of deeper support. The 1.2200 area seems key, and there’s a prior swing at the 1.2270 level that remains of interest.
GBP/USD Daily Price Chart
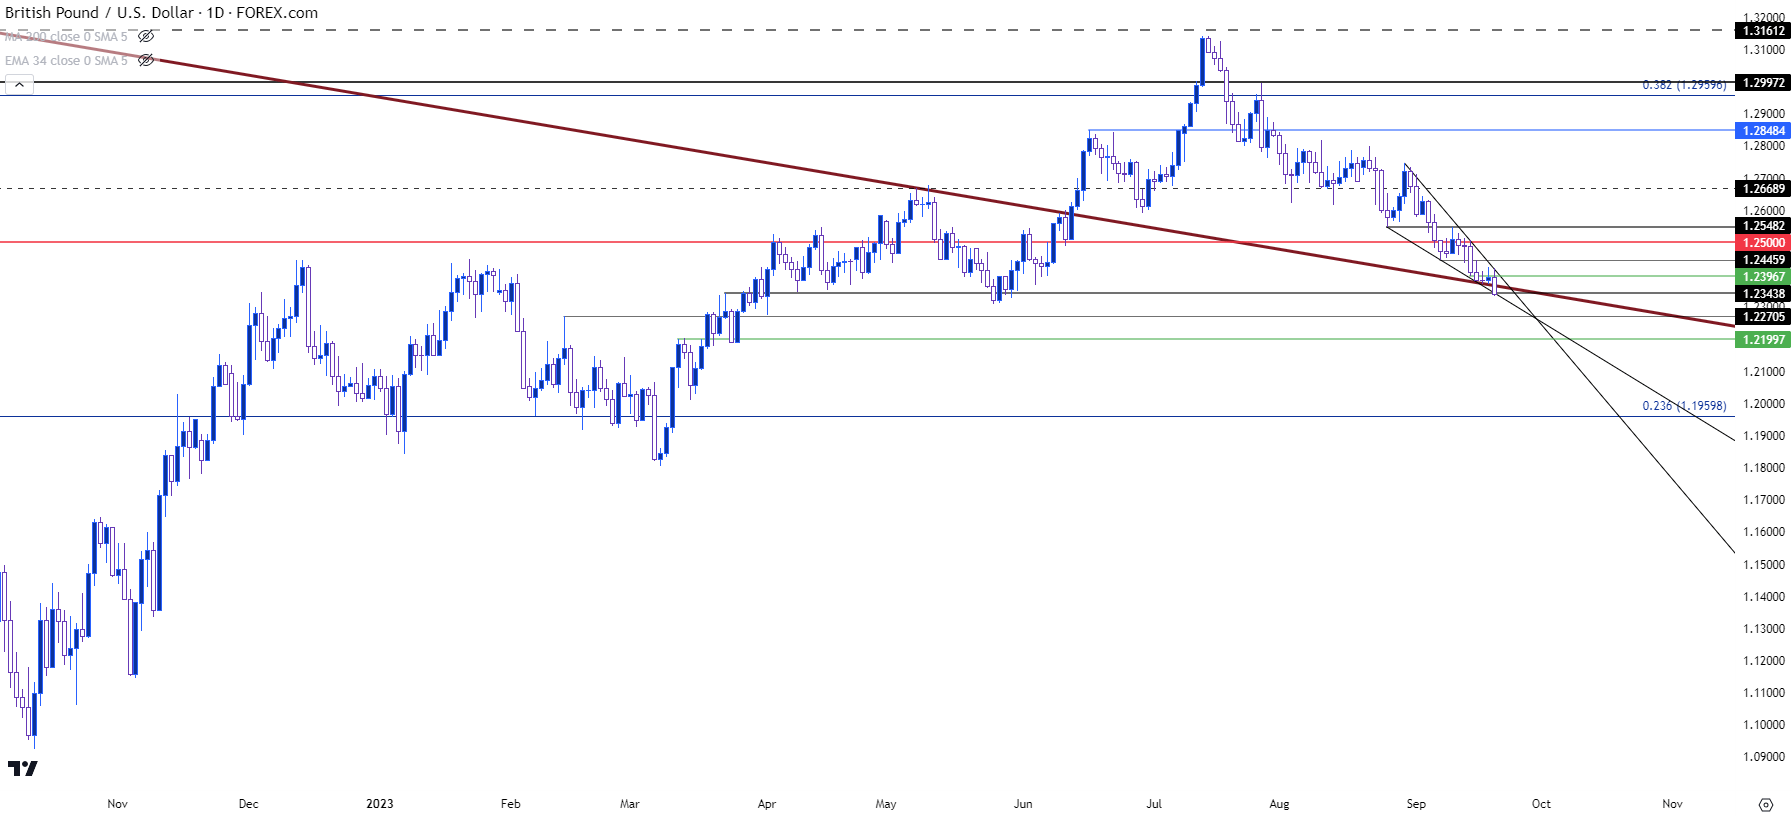
Chart prepared by James Stanley, GBP/USD on Tradingview
GBP/JPY
While much of the attention was tilted towards the US for the Federal Reserve’s rate hikes, there remains a brewing theme in Japan around the BoJ’s continued dovish stance. And there’s a Bank of Japan rate decision taking place after tomorrow’s BoE meeting.
I took a longer-term look at the context in GBP/JPY a couple of weeks ago, and price remains at a key spot of long-term resistance around 183.94.
From the weekly chart below, we can see the update on the long-term setup, with lower-highs for each of the past three weeks with support breaking below the Fibonacci level at 183.94 and establishing another lower-low in the 182.29-182.53 zone.
GBP/JPY Weekly Price Chart
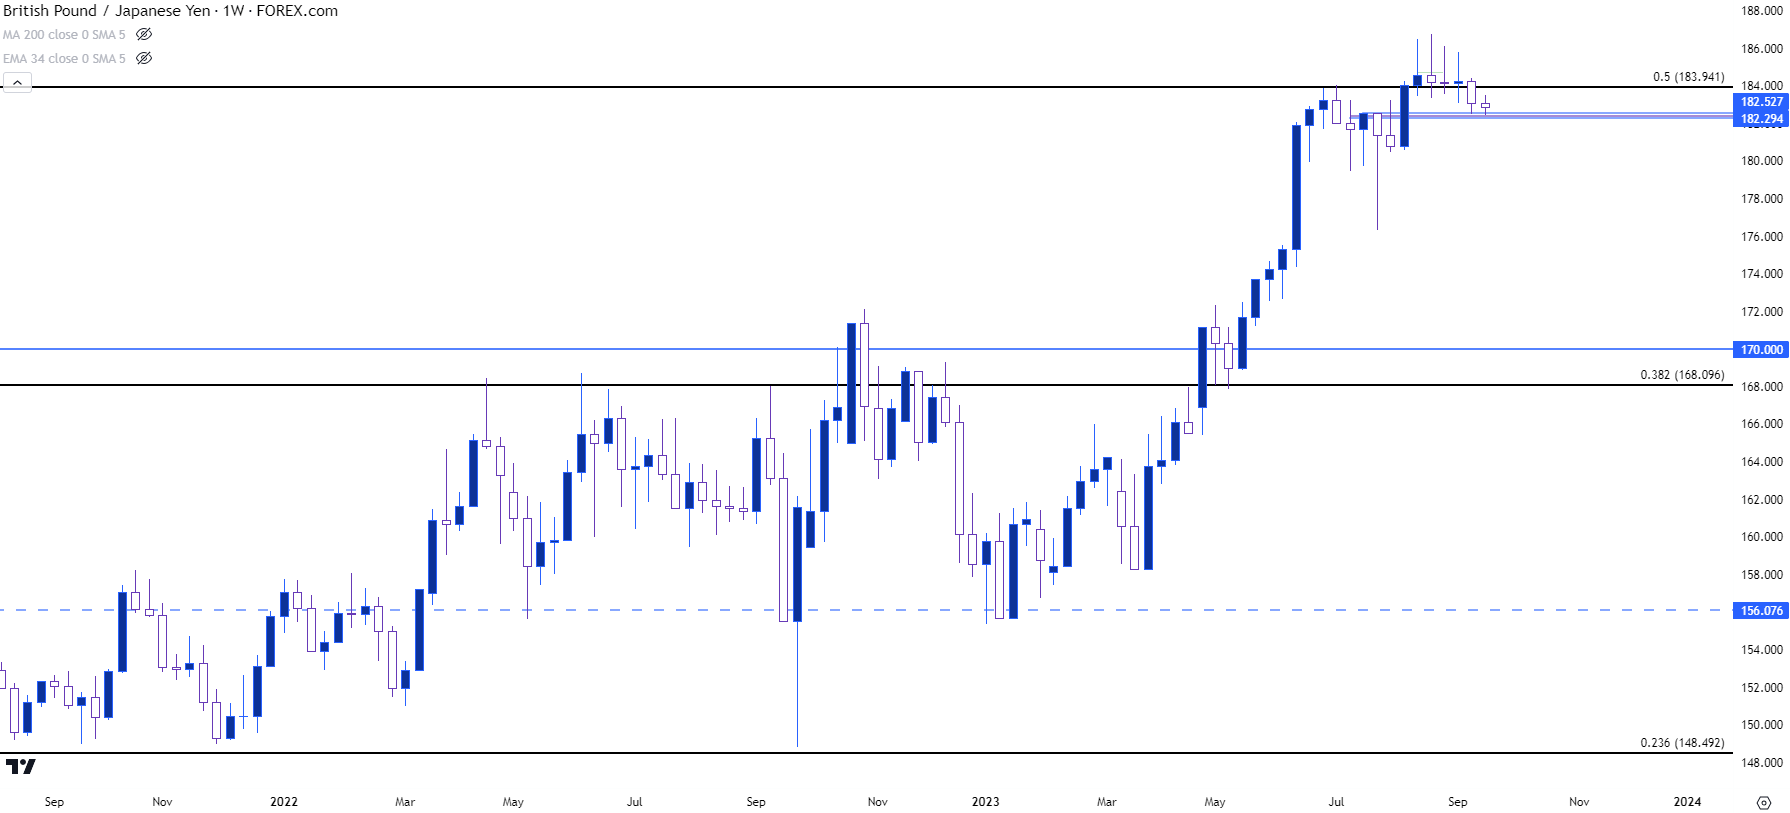
Chart prepared by James Stanley, GBP/JPY on Tradingview
From the four-hour chart of GBP/JPY, we can see those lower-highs coupled with horizontal support, which highlights a recent bearish bias.
The Fibonacci level at 183.94 remains as near-term resistance, but if bears can take a swing to fresh lows around the BoE and/or the BoJ rate decisions tomorrow, there’s deeper support potential around 181.74, followed by 180.53 and then the 180 psychological level.
GBP/JPY Four-Hour Price Chart
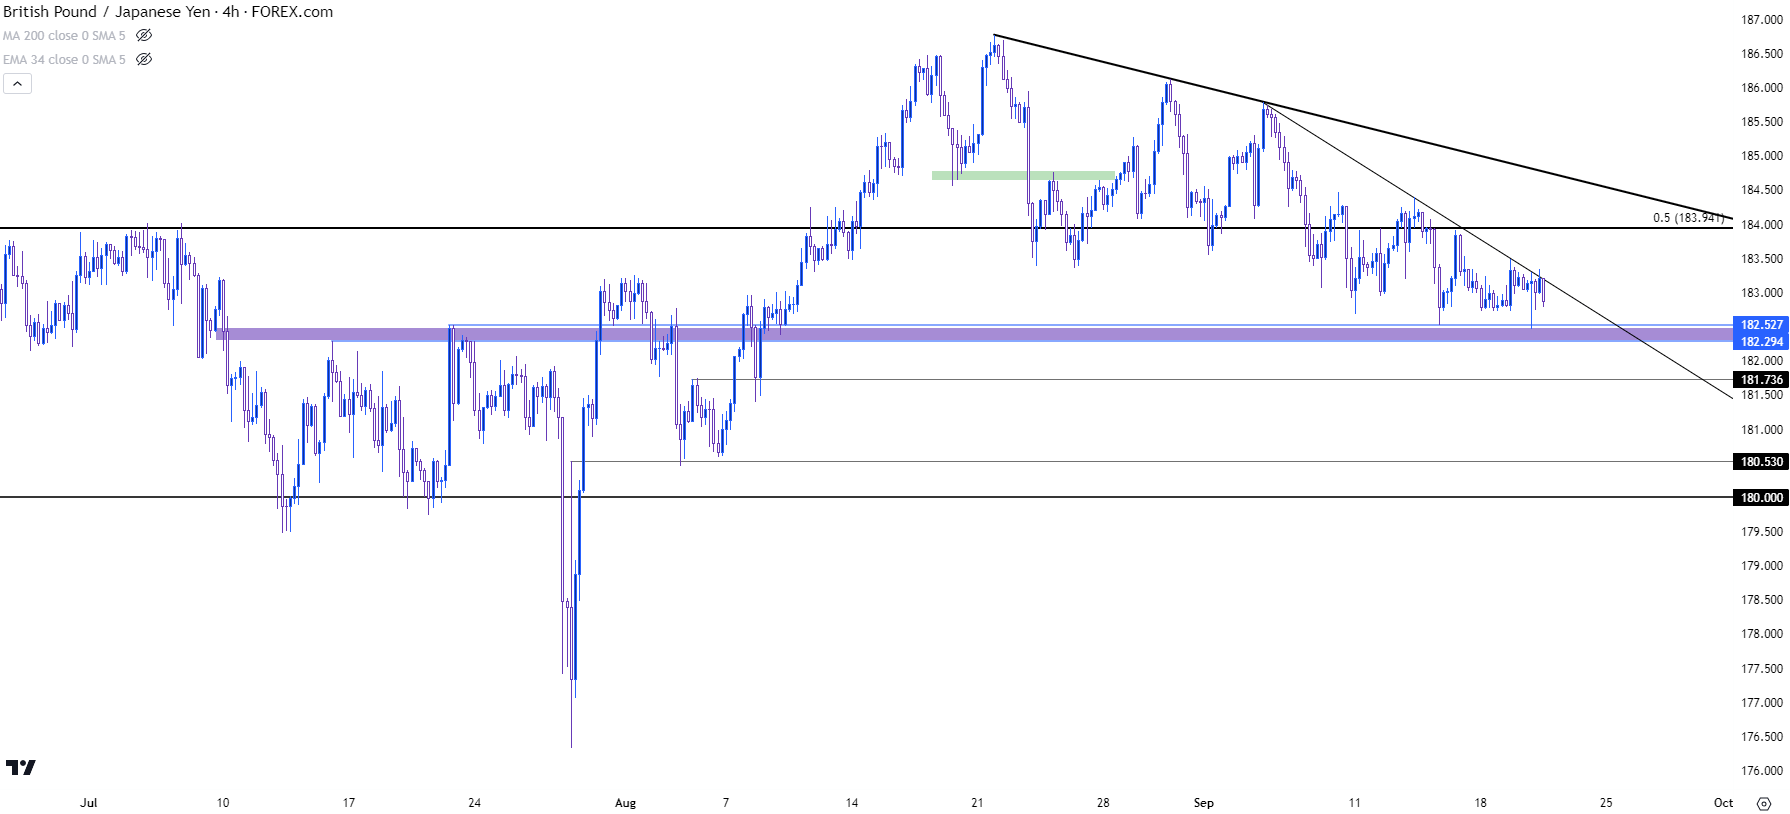
Chart prepared by James Stanley, GBP/JPY on Tradingview
--- written by James Stanley, Senior Strategist
