British Pound Technical Analysis: GBP/USD, GBP/JPY

Multiple pound notes £5, £20 and £50 Pound Sterling
NA-meet-our-team-James-Stanley-125x125
By :  ,  Sr. Strategist

British Pound Talking Points:

  • Sterling weakness is showing against both the US Dollar and Japanese Yen so far today, with Cable pushing down to a fresh eight-month-low and making a run towards the 1.2300 handle.
  • GBP/JPY meanwhile continues to battle it out within a big zone with some longer-term context. But, with that said, the daily chart is showing a non-completed evening star formation and that sets the stage for a key support test in the pair.
  • I’ll be looking at the U.S. Dollar from multiple vantage points in Tuesday's webinar: Click here for registration information.

Get our exclusive guide to GBP/USD trading in 2025


The USD freight train continues to chug along and at this point Cable is seeing some additional British Pound weakness, helping the pair to push down to fresh eight-month-lows. As of this writing, EUR/USD remains inside of its prior low and DXY remains inside of its prior high, which helps to illustrate the GBP-weakness that’s playing a role in the move today. But this is evident elsewhere, as well, as GBP/JPY is currently working on a not-completed evening star formation on the daily chart which sets the stage for a key support test just below the 195.00 handle.

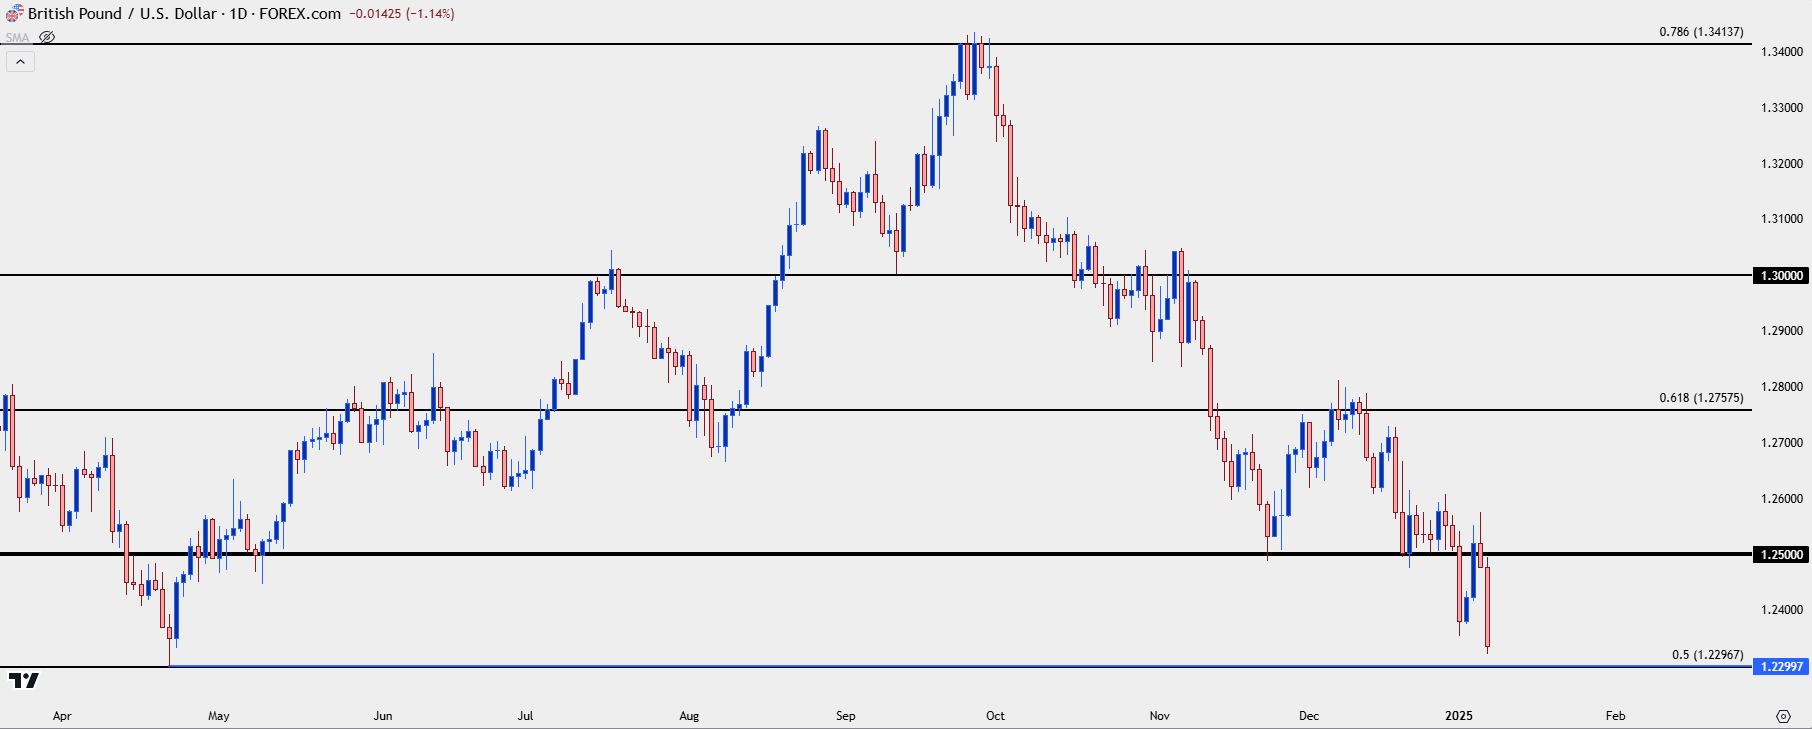
In the major pair, GBP/USD is nearing re-test of a major level around the 1.2300 handle. This was the spot that held the lows back in April of last year, so if bears can break through, we’ll be looking at a fresh yearly low in the pair. This is also near the 50% marker of the 2021-2022 major move which plots at 1.2297.

Notably, the 78.6% retracement and 61.8% retracement from that same Fibonacci setup have helped to form some key inflection points, including last year’s swing high around the 78.6% mark and then last month’s swing-high around the 61.8% level.


GBP/USD Weekly Chart

gbpusd weekly 1825Chart prepared by James Stanley, GBP/USD on Tradingview


GBP/USD Shorter-Term


The challenge for sellers at this point would be the prospect of chasing so near a possible support level. But – given prior support at the 1.2500 handle, there is context for lower-high resistance around that psychological level, as that price had held as support in both November and December of last year and, to date, it hasn’t shown much for resistance on the daily chart, as of yet.


GBP/USD Daily Price Chart
gbpusd daily 1825Chart prepared by James Stanley, GBP/USD on Tradingview


GBP/USD Shorter-Term


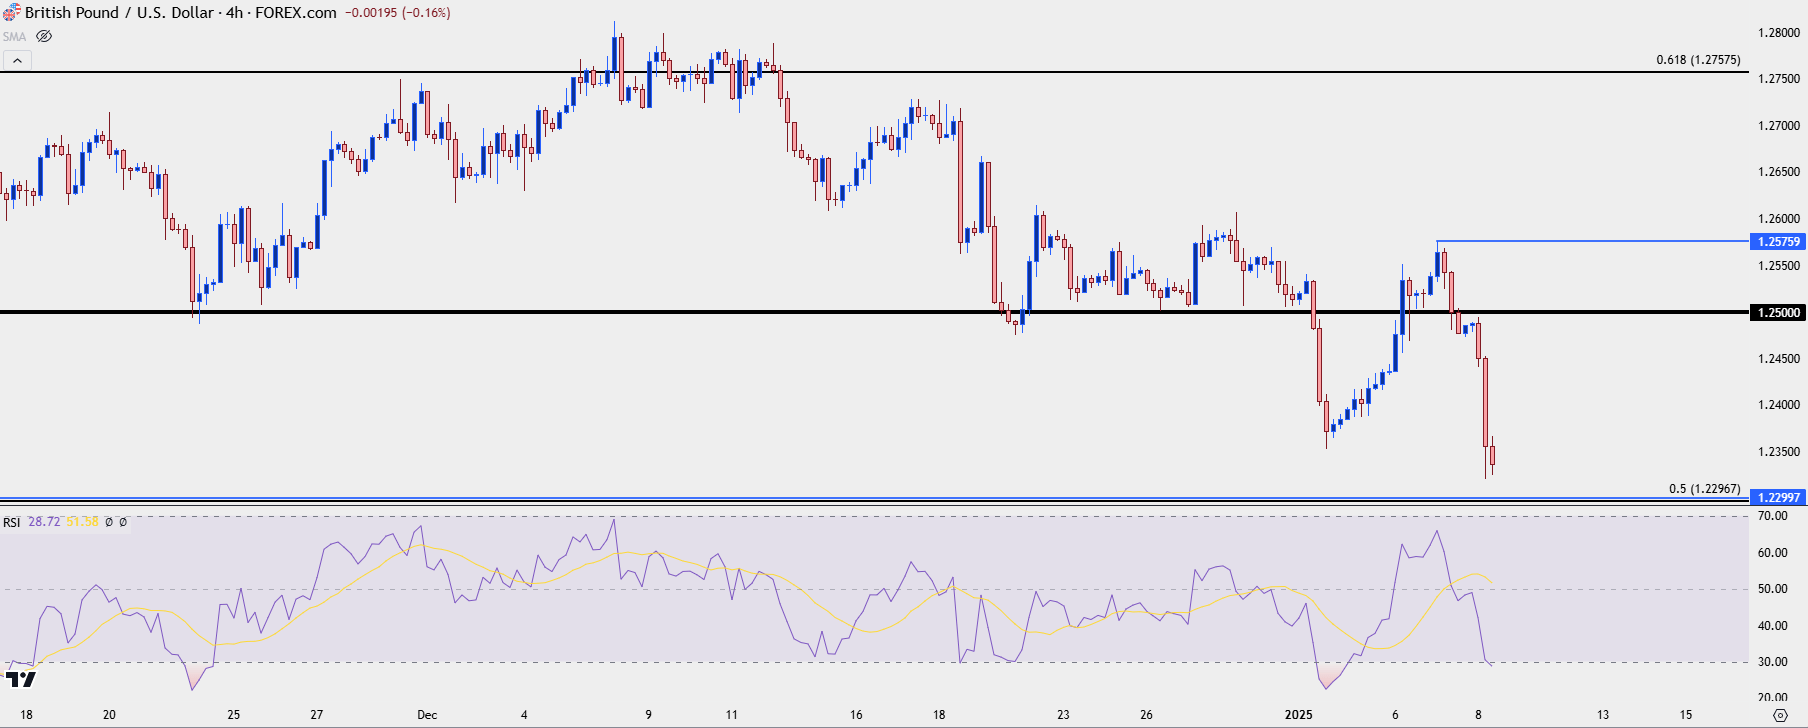
At this point with Cable pushing down to a fresh low and nearing that support level, there’s also the prospect of possible divergence in RSI on the four-hour chart. Something like this can open the door for counter-trend potential, although the initial idea there would be for a corrective move rather than a full-on trend change, which would be impossible to predict at this point given that price is pushing down to fresh lows. But – should support show and a bounce form, this would open the door for a move towards that 1.2500 level that was previously support, and that’s where sellers would be centerstage to see whether they defend that level of prior support from the past couple of months.


GBP/USD Four-Hour Chart
gbpusd four hour 1825Chart prepared by James Stanley, GBP/USD on Tradingview


GBP/JPY


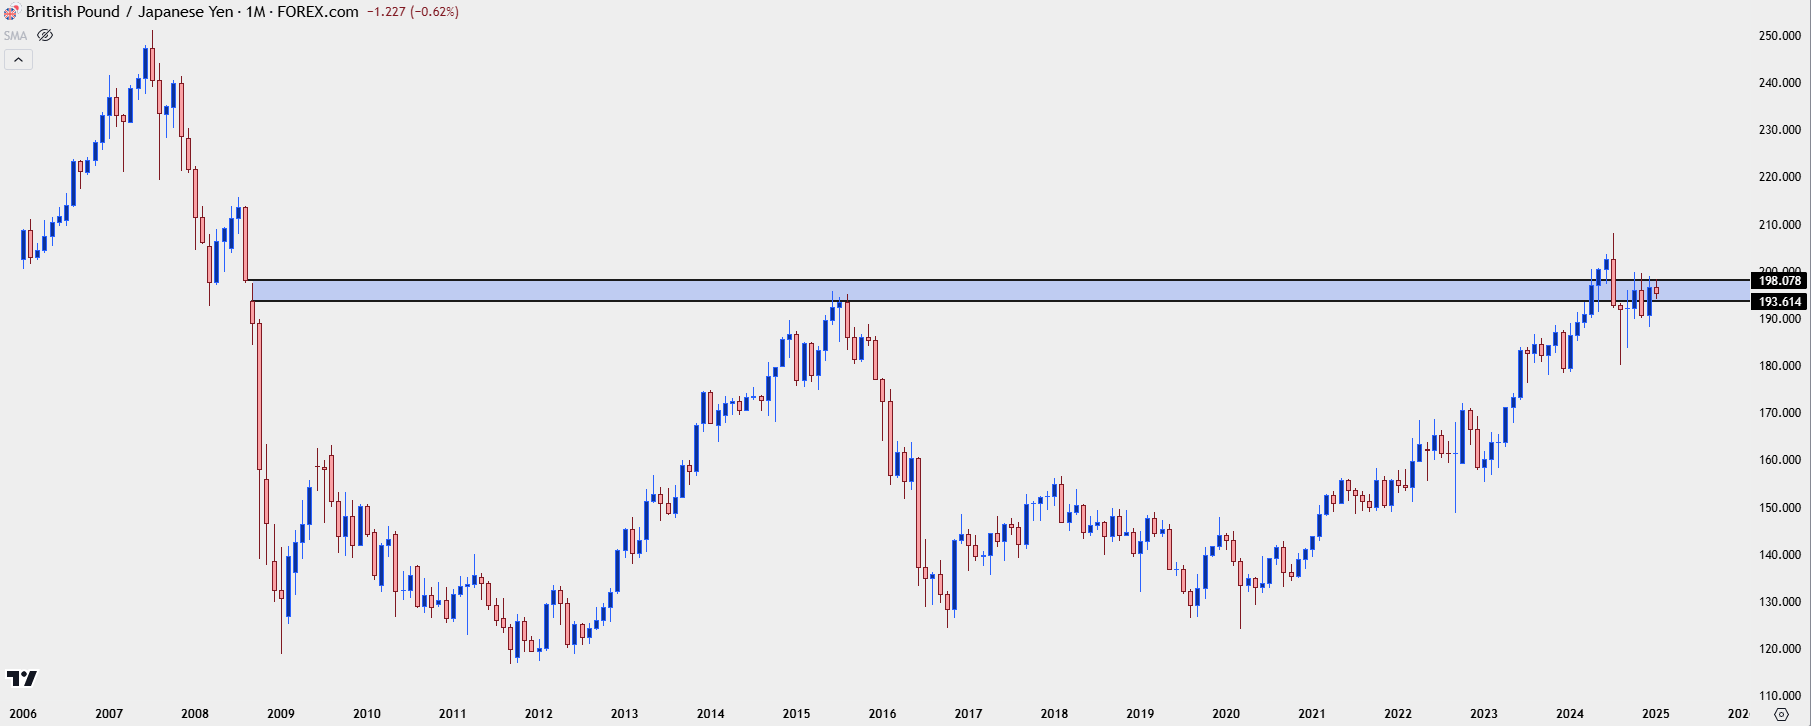
GBP/JPY continues to battle it out at a long-term zone of interest. From the monthly chart, there was a gap back in 2008 that continues to hold weight today. The August 2008 close at 198.08 led into the September 2008 open at 193.61.

The bottom of that zone is what came into help hold the highs in 2015, and that zone was back in-play last year as the pair was pushing higher for its first test above 2008 in more than 15 years.

Initially, 193.61 helped to hold resistance in March of last year and then 198.08 was in-play as resistance a month later, before becoming support in June. But when JPY reversed aggressively in July, price action pushed back-below the big zone and for the past four months, the top-end of that area has helped to hold the highs.


GBP/JPY Monthly Price Chart
gbpjpy monthly 1825Chart prepared by James Stanley, GBP/JPY on Tradingview


GBP/JPY Weekly


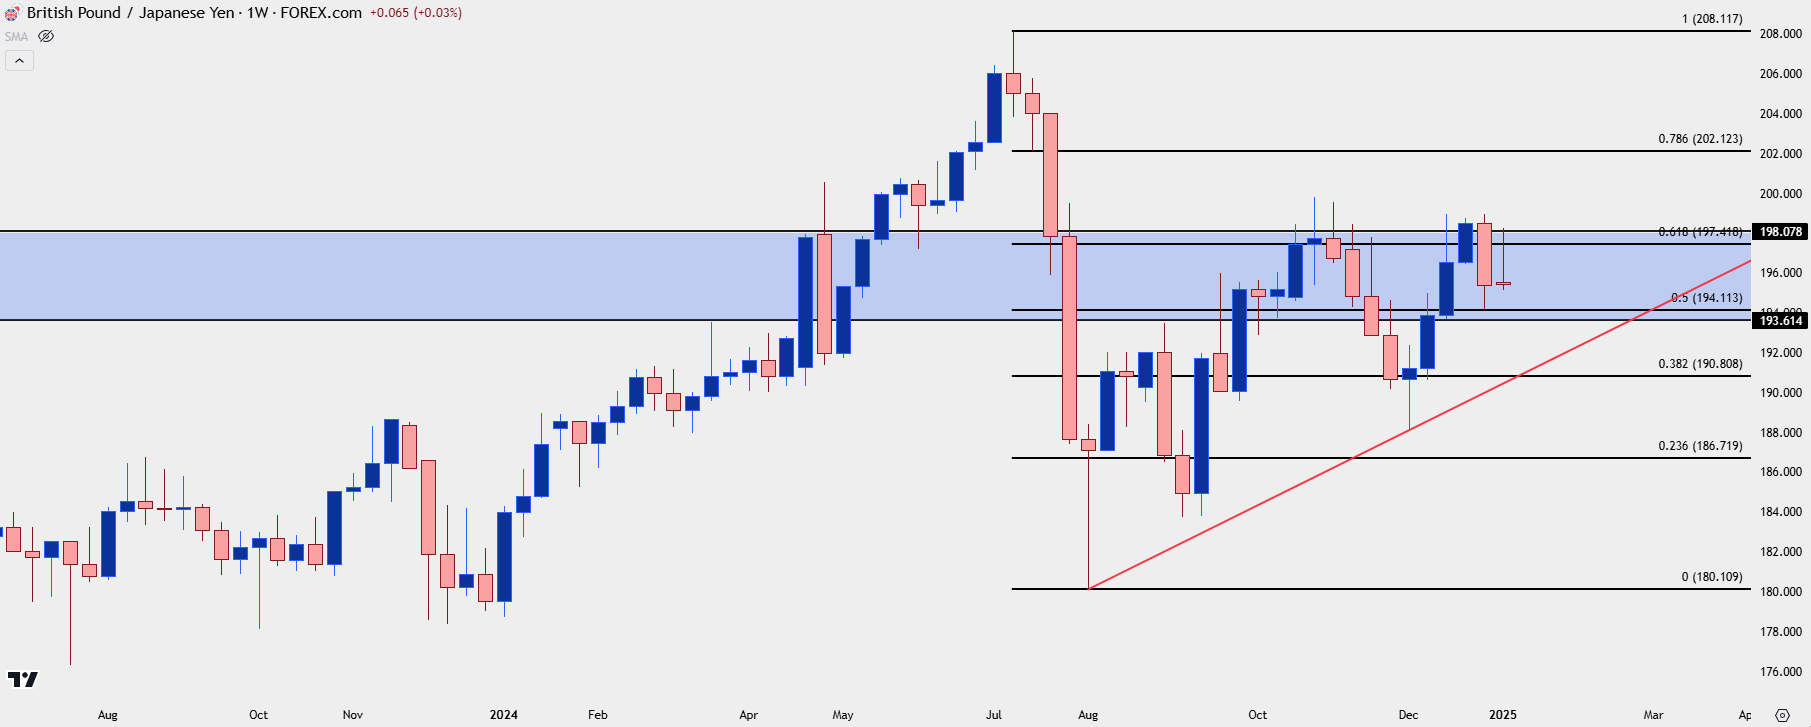
From the weekly chart we can see where price in the pair has been making both higher-lows and lower-highs, which illustrates a degree of digestion. But even shorter-term we can see where price has been bound within that longer-term zone over the past few weeks, and the top-end at 198.08 has so far helped to hold the weekly high.


GBP/JPY Weekly Chart
gbpjpy weekly 1825Chart prepared by James Stanley, GBP/JPY on Tradingview


GBP/JPY Daily Chart


Echoing today’s weakness in GBP/USD above, GBP/JPY is similarly showing a red daily candle, and, in this case, there can even be a possible evening star formation coming into the picture. Yesterday’s daily bar took on a tone of indecision and the weakness that’s followed through today has helped to produce the third part of that formation, although the daily candle yet is not closed so we can’t confirm the formation, at this point. But – that sets the stage for a re-test of the 50-pip zone from the bottom of the longer-term gap at 193.61 to the Fibonacci level at 194.11.

If bulls are unable to hold that, the next major level on my chart is the 38.2% Fibonacci retracement of that same move, and there’s a minor level of prior resistance-turned-support around the 192.50 psychological level.


GBP/JPY Daily Chart
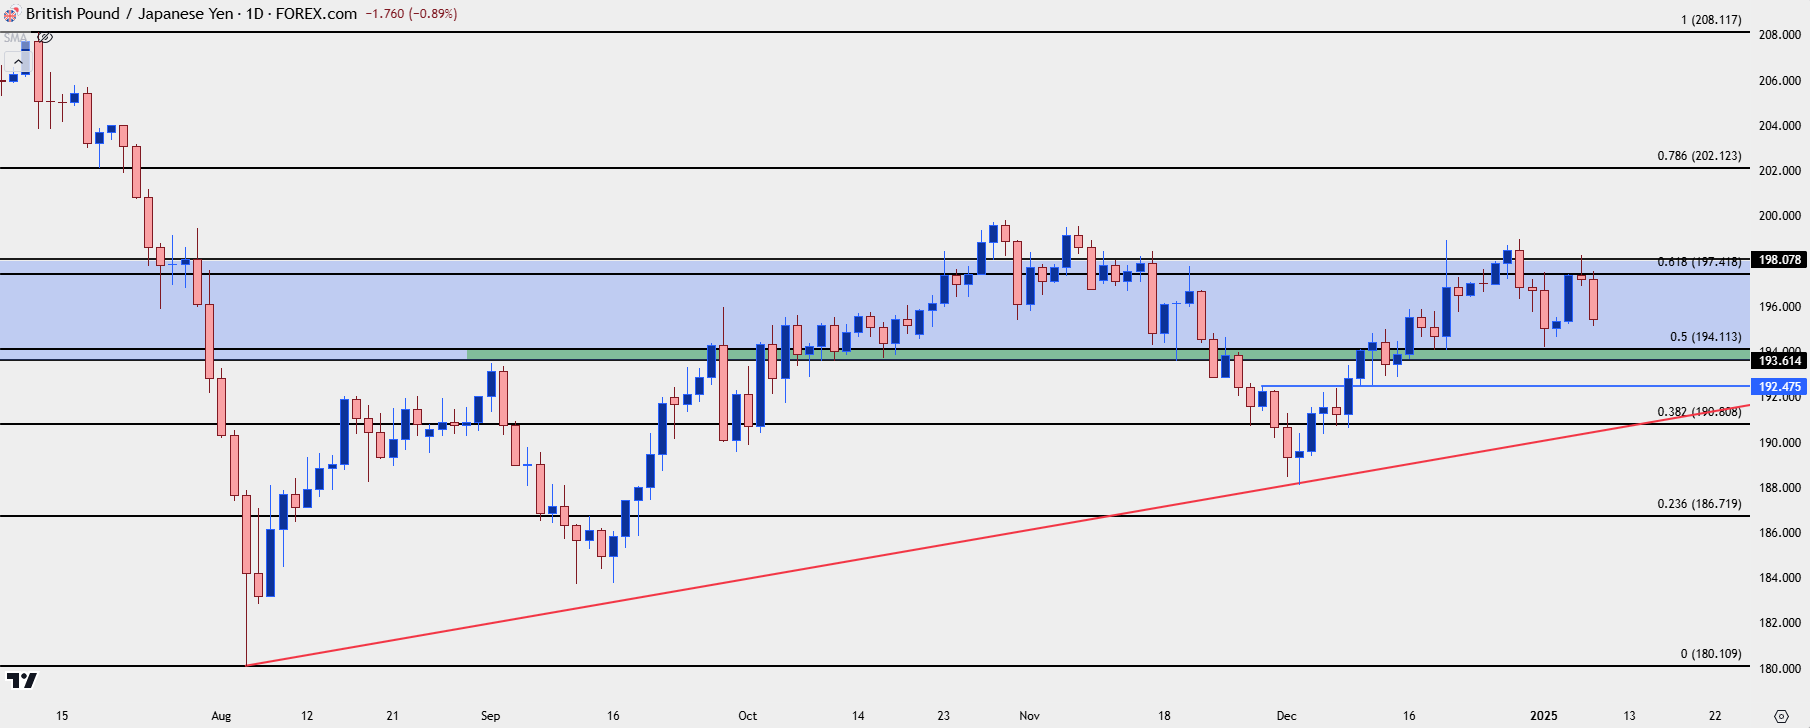
gbpjpy daily 1825Chart prepared by James Stanley, GBP/JPY on Tradingview


--- written by James Stanley, Senior Strategist


British Pound Talking Points:

  • Sterling weakness is showing against both the US Dollar and Japanese Yen so far today, with Cable pushing down to a fresh eight-month-low and making a run towards the 1.2300 handle.
  • GBP/JPY meanwhile continues to battle it out within a big zone with some longer-term context. But, with that said, the daily chart is showing a non-completed evening star formation and that sets the stage for a key support test in the pair.
  • I’ll be looking at the U.S. Dollar from multiple vantage points in tomorrow’s webinar: Click here for registration information.


The USD freight train continues to chug along and at this point Cable is seeing some additional British Pound weakness, helping the pair to push down to fresh eight-month-lows. As of this writing, EUR/USD remains inside of its prior low and DXY remains inside of its prior high, which helps to illustrate the GBP-weakness that’s playing a role in the move today. But this is evident elsewhere, as well, as GBP/JPY is currently working on a not-completed evening star formation on the daily chart which sets the stage for a key support test just below the 195.00 handle.

In the major pair, GBP/USD is nearing re-test of a major level around the 1.2300 handle. This was the spot that held the lows back in April of last year, so if bears can break through, we’ll be looking at a fresh yearly low in the pair. This is also near the 50% marker of the 2021-2022 major move which plots at 1.2297.

Notably, the 78.6% retracement and 61.8% retracement from that same Fibonacci setup have helped to form some key inflection points, including last year’s swing high around the 78.6% mark and then last month’s swing-high around the 61.8% level.


GBP/USD Weekly Chart

gbpusd weekly 1825Chart prepared by James Stanley, GBP/USD on Tradingview


GBP/USD Shorter-Term


The challenge for sellers at this point would be the prospect of chasing so near a possible support level. But – given prior support at the 1.2500 handle, there is context for lower-high resistance around that psychological level, as that price had held as support in both November and December of last year and, to date, it hasn’t shown much for resistance on the daily chart, as of yet.


GBP/USD Daily Price Chart

gbpusd daily 1825Chart prepared by James Stanley, GBP/USD on Tradingview


GBP/USD Shorter-Term


At this point with Cable pushing down to a fresh low and nearing that support level, there’s also the prospect of possible divergence in RSI on the four-hour chart. Something like this can open the door for counter-trend potential, although the initial idea there would be for a corrective move rather than a full-on trend change, which would be impossible to predict at this point given that price is pushing down to fresh lows. But – should support show and a bounce form, this would open the door for a move towards that 1.2500 level that was previously support, and that’s where sellers would be centerstage to see whether they defend that level of prior support from the past couple of months.


GBP/USD Four-Hour Chart

gbpusd four hour 1825Chart prepared by James Stanley, GBP/USD on Tradingview


GBP/JPY


GBP/JPY continues to battle it out at a long-term zone of interest. From the monthly chart, there was a gap back in 2008 that continues to hold weight today. The August 2008 close at 198.08 led into the September 2008 open at 193.61.

The bottom of that zone is what came into help hold the highs in 2015, and that zone was back in-play last year as the pair was pushing higher for its first test above 2008 in more than 15 years.

Initially, 193.61 helped to hold resistance in March of last year and then 198.08 was in-play as resistance a month later, before becoming support in June. But when JPY reversed aggressively in July, price action pushed back-below the big zone and for the past four months, the top-end of that area has helped to hold the highs.


GBP/JPY Monthly Price Chart

gbpjpy monthly 1825Chart prepared by James Stanley, GBP/JPY on Tradingview


GBP/JPY Weekly


From the weekly chart we can see where price in the pair has been making both higher-lows and lower-highs, which illustrates a degree of digestion. But even shorter-term we can see where price has been bound within that longer-term zone over the past few weeks, and the top-end at 198.08 has so far helped to hold the weekly high.


GBP/JPY Weekly Chart

gbpjpy weekly 1825Chart prepared by James Stanley, GBP/JPY on Tradingview


GBP/JPY Daily Chart


Echoing today’s weakness in GBP/USD above, GBP/JPY is similarly showing a red daily candle, and, in this case, there can even be a possible evening star formation coming into the picture. Yesterday’s daily bar took on a tone of indecision and the weakness that’s followed through today has helped to produce the third part of that formation, although the daily candle yet is not closed so we can’t confirm the formation, at this point. But – that sets the stage for a re-test of the 50-pip zone from the bottom of the longer-term gap at 193.61 to the Fibonacci level at 194.11.

If bulls are unable to hold that, the next major level on my chart is the 38.2% Fibonacci retracement of that same move, and there’s a minor level of prior resistance-turned-support around the 192.50 psychological level.


GBP/JPY Daily Chart

gbpjpy daily 1825Chart prepared by James Stanley, GBP/JPY on Tradingview


--- written by James Stanley, Senior Strategist


Open an account in minutes

Experience award-winning platforms with fast and secure execution.

Web Trader platform

Our sophisticated web-based platform is packed with features.
Economic Calendar