British Pound Technical Outlook: GBP/USD Short-Term Trade Levels
- British Pound testing break of 200DMA for first time since March
- GBP/USD weekly range break threatens deeper losses- key support in view
- Sterling Resistance 1.2548, 1.2579, 1.2674/80- Support 1.2379, 1.2275-1.2314 (key), 1.2084
The British Pound remains on defense verse the US Dollar with GBP/USD plunging more than 1.1% off the weekly highs. In total, Sterling has now fallen more than 5.6% off the July / yearly high with today’s decline now threatening a break below technical support. The battle lines are drawn ahead of next week’s highly anticipated FOMC / BoE interest rate decisions and we’re on the lookout for possible downside exhaustion lower. These are the updated targets and invalidation levels that matter on the GBP/USD short-term technical.
Review my latest Weekly Strategy Webinar for an in-depth breakdown of this Sterling setup and more. Join live on Monday’s at 8:30am EST.
British Pound Price Chart – GBP/USD Daily

Chart Prepared by Michael Boutros, Sr. Technical Strategist; GBP/USD on TradingView
Technical Outlook: In last month’s British Pound Short-term Outlook we noted that GBP/USD was, “carving out a well-defined monthly opening-range just above multi-month uptrend support – a breakout is imminent in the days ahead. From a trading standpoint, the threat does remain tilted to the downside while within this range with a breakout to ultimately offer further conviction…” A break below uptrend support the following day was tested as resistance on August 22nd before plunging more than 3.1% off the highs. The decline is now attempting to break below confluent support at the 200-day moving average / December swing high at 1.2432/46.
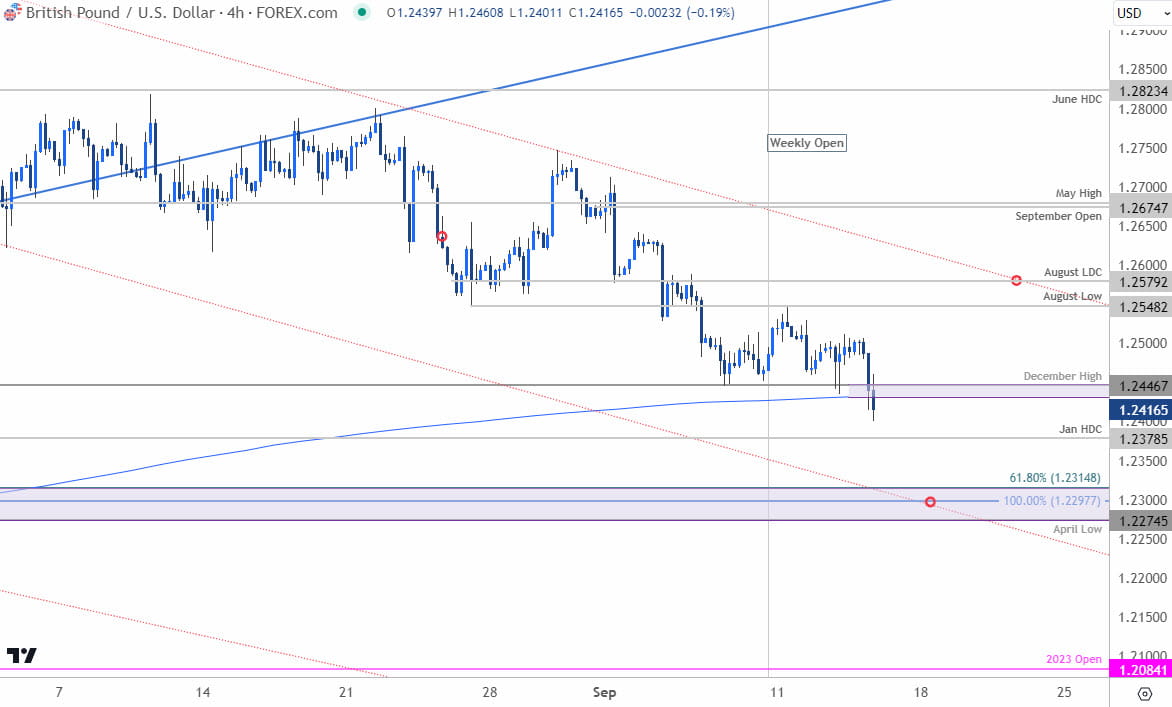
British Pound Price Chart – GBP/USD 240min

Chart Prepared by Michael Boutros, Sr. Technical Strategist; GBP/USD on TradingView
Notes: A closer look at Sterling price action shows GBP/USD continuing to trade within the confines of a descending channel formation extending off the late-July high. The weekly opening-range was set just above support with price now probing lower- watch the close here.
A continued break lower exposes the January high-day close at 1.2378 and a key support confluence at 1.2275-1.2315 – a region defined by the April swing low, the 100% extension of the July decline and the 61.8% Fibonacci retracement of the objective yearly range. An area of interest for possible downside exhaustion / price inflection IF reached.
Initial resistance is eyed at the weekly high / August low at 1.2548 and is backed closely by the August low-day close / the upper parallel (red) near 1.2580. Rallied should be limited to this region IF price is heading lower on this stretch with broader bearish invalidation now lowered to the objective September open / May high at 1.2674/80.
Bottom line: The British Pound is attempting to break confluent support here and threatens a steeper decline towards the lower parallel. From a trading standpoint, look to reduce short-exposure / lower protective stops on a stretch towards the 1.23-handle- rallies should be limited to 1.2580 IF price is heading lower on this move.
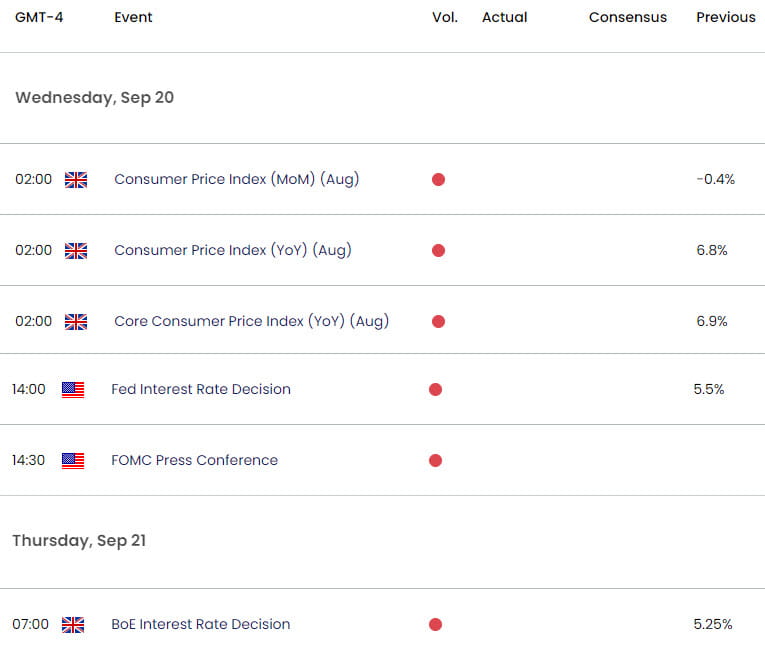
Keep in mind the FOMC and BoE interest rate decisions are on tap next week and could generate a good deal of volatility here. Ultimately, we’re on the lookout for an exhaustion low in the days ahead to give way to larger recovery in the pound- stay nimble into the releases. Review my latest British Pound Weekly Forecast for a closer look at the longer-term GBP/USD trade levels.
Key GBP/USD Economic Data Releases

Economic Calendar - latest economic developments and upcoming event risk.
Active Short-term Technical Charts
- Euro Short-term Outlook: EUR/USD Bears Halted Ahead of ECB, FOMC
- Canadian Dollar Short-term Outlook: USD/CAD Correction Underway
- S&P 500 Short-term Price Outlook: Gap Trap
- Crude Oil Short-term Outlook: Oil Spill Searches for Support
- Gold Price Short-term Outlook: XAU/USD Searches Support Sub-1900
- US Dollar Short-term Outlook: USD Rally Set to Snap
--- Written by Michael Boutros, Sr Technical Strategist with FOREX.com
Follow Michael on Twitter @MBForex


