British Pound Technical Outlook: GBP/USD Short-Term Trade Levels
- British Pound rallies more than 3.25% off yearly low- May opening-range breaks higher
- GBP/USD approaching significant technical resistance into yearly downtrend- risk for price inflection
- Resistance 1.2731, 1.2773/81, 1.2857- Support 1.2575, 1.2535, 1.2423
The British Pound surged 1.4% since the start of the week with the post-CPI rally fueling a breakout of the May opening-range. GBP/USD has now rallied more than 3.25% off the yearly lows registered last month and the advance is now approaching more significant technical resistance into the yearly downtrend. Battle lines drawn on the Sterling short-term technical charts.
Review my latest Weekly Strategy Webinar for an in-depth breakdown of this GBP/USD setup and more. Join live on Monday’s at 8:30am EST.
British Pound Price Chart – GBP/USD Daily

Chart Prepared by Michael Boutros, Sr. Technical Strategist; GBP/USD on TradingView
Technical Outlook: In last month’s British Pound Short-term Outlook we noted that GBP/USD was, “testing downtrend support with a key technical confluence seen just lower- risk for possible price inflection here.” The focus was on a reaction into, “1.2337/64- a region defined by the October swing high, the 100% extension of the March decline, and the 61.8% Fibonacci retracement of the October advance.” Sterling briefly registered an intraday low at 1.23 the following week before rebounding sharply with GBP/USD now up more than 3.25% off the lows. Price broke through the May opening-range on the heels of yesterday’s US CPI release with the advance now approaching more significant technical resistance into the yearly downtrend. Looking for a possible reaction on stretch higher IF reached.
British Pound Price Chart – GBP/USD 240min

Chart Prepared by Michael Boutros, Sr. Technical Strategist; GBP/USD on TradingView
Notes: A closer look at Sterling price action shows GBP/USD trading within the confines of a near-term, embedded ascending channel formation (red) with the upper parallel highlighting confluent resistance levels at the objective yearly-open at 1.2731 and the February 2019 low / 100% extension of the April advance at 1.2773/81- both levels of interest for possible topside exhaustion / price inflection IF reached. Note that a topside breach above this threshold would suggest a that a more significant low was registered last month and keep the focus on a stretch towards the yearly high-day close (HDC) at 1.2857- watch the weekly closes.
Initial support rests with the March low at 1.2575 backed closely by near-term bullish invalidation at the February close-low / 200-day moving average near 1.2535/40- a break / close below this level would threaten a retest of the lows. Subsequent support seen at the 2022 December high-day close (HDC) at 1.2423 with 1.2337/64 still key.
Bottom line: A breakout of the monthly opening-range keeps the outlook weighted to the topside into the close of the month with major resistance levels eyed just higher- risk for possible exhaustion / price inflection. From at trading standpoint, look to reduce long-exposure / raise protective stops on a stretch towards the upper parallels – IF this rebound off the yearly lows is corrective in nature, rallies should be limited to 1.2781. Keep in mind we get key UK CPI and retail sales next week- watch the closes for guidance here. Review my latest British Pound Weekly Forecast for a closer look at the longer-term GBP/USD trade levels.
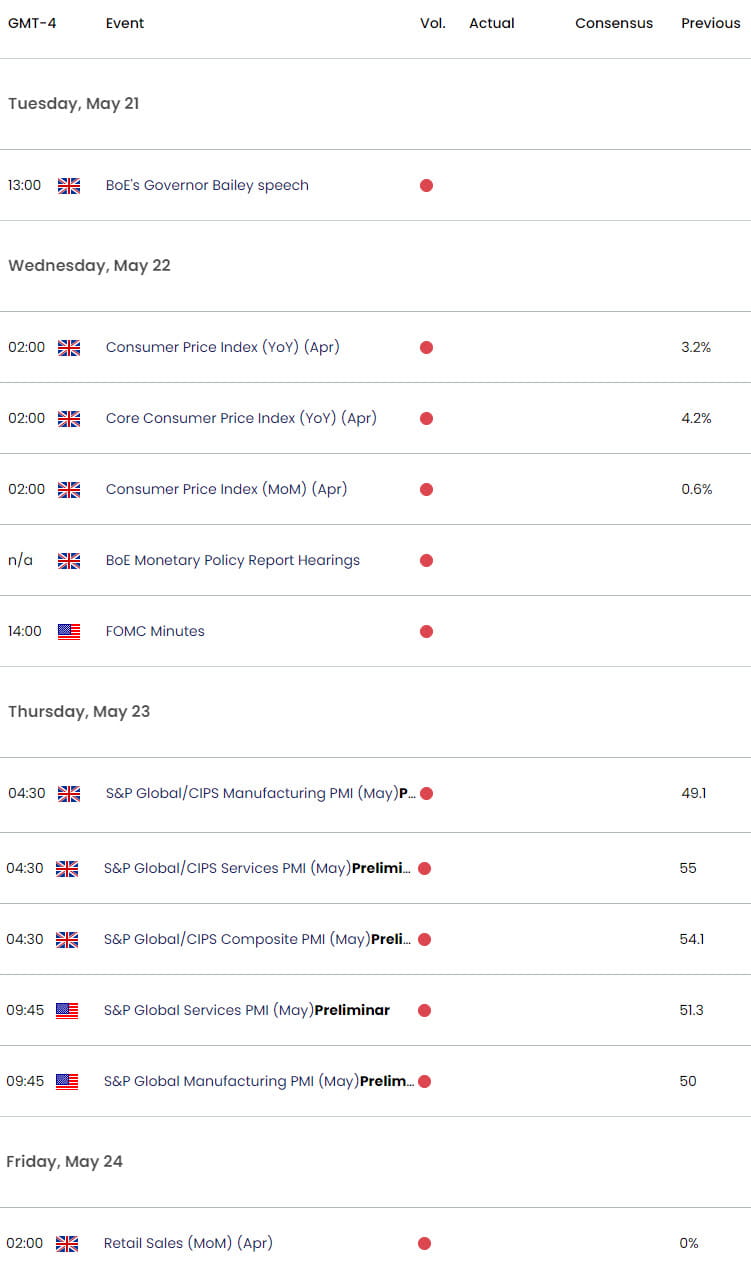
Key GBP/USD Economic Data Releases

Economic Calendar - latest economic developments and upcoming event risk.
Active Short-term Technical Charts
- Australian Dollar Short-term Outlook: AUD/USD at Major Resistance
- Gold Short-term Outlook: XAU/USD Poised for CPI Breakout
- Euro Short-term Technical Outlook: EUR/USD Rally at Resistance
- Canadian Dollar Short-term Outlook: USD/CAD Bulls Face the Fed, NFPs
- US Dollar Short-term Outlook: USD Bulls Rest Ahead of PCE, Fed
--- Written by Michael Boutros, Sr Technical Strategist with FOREX.com
Follow Michael on X @MBForex


