British Pound Technical Outlook: GBP/USD Short-Term Trade Levels
- British Pound breaks 2024 yearly opening-range- plunges back below 200-day moving average
- GBP/USD now testing multi-week downtrend- more significant technical support just lower
- Resistance 1.2523, 1.2594-1.2623, 1.2708/31– Support 1.2423, 1.2337/64 (key), 1.2220
The British Pound plummeted more than 3.7% off the March highs with a break of the yearly-opening-range now approaching multi-month trend support- risk for possible downside exhaustion / price inflection in the days ahead. These are the updated targets and invalidation levels that matter on the GBP/USD short-term technical charts.
Review my latest Weekly Strategy Webinar for an in-depth breakdown of this Sterling setup and more. Join live on Monday’s at 8:30am EST.
British Pound Price Chart – GBP/USD Daily

Chart Prepared by Michael Boutros, Sr. Technical Strategist; GBP/USD on TradingView
Technical Outlook: In last month’s British Pound Short-term Outlook we noted that GBP/USD was, “approaching key support hurdles that IF broken, could compromise the February uptrend…” We once again highlighted key resistance, “at 1.2773-1.2823- a region defined by the February 2019 low, the 2024 yearly opening-range highs, and the June high-day close (HDC).” Sterling registered an intraday high at 1.2803 the following day before reversing sharply lower with GBP/USD now off more than 3% from those highs.
The immediate focus is on a cluster of lateral support levels just lower with longer-term slope support (blue) also converging on this region. The burden is on the bears to follow-through on a break of the yearly opening-range lows.
British Pound Price Chart – GBP/USD 240min

Chart Prepared by Michael Boutros, Sr. Technical Strategist; GBP/USD on TradingView
Notes: A closer look at Sterling price action shows GBP/USD trading into confluent support early in the week at the 2022 December high-day close (HDC) around 1.2423. A more significant technical confluence zone rests just lower at 1.2337/64- a region defined by the October swing high, the 100% extension of the March decline, and the 61.8% Fibonacci retracement of the October advance. Look for a larger reaction there IF reached with a break / weekly close below needed to suggest a larger trend reversal is underway towards the 78.6% retracement near 1.2220.
Look for initial resistance at the 23.6% retracement (currently ~1.2523) with key resistance now lowered to the 38.2% retracement / objective April open at 1.2594-1.2323. Note that channel resistance also converges on this threshold over the next few weeks. Broader bearish invalidation now lowered to the 61.8% retracement / 2024 yearly-open at 1.2708/31.
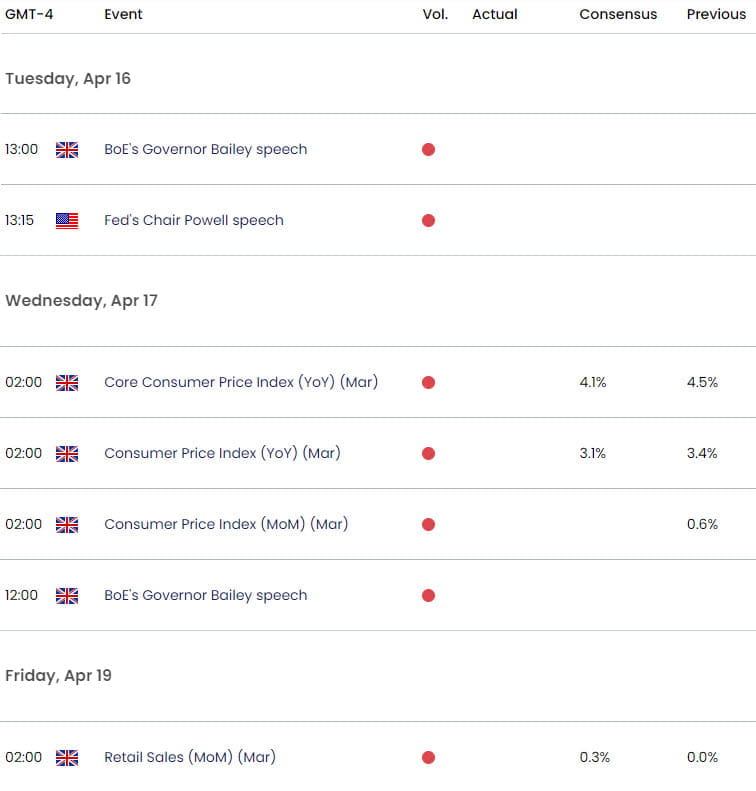
Bottom line: Sterling is testing downtrend support with a key technical confluence seen just lower- risk for possible price inflection here. From at trading standpoint, a good zone to reduce portions of short-exposure / lower protective stops – rallies should be limited to the monthly open IF price is heading lower on this stretch with a close below 1.2337 needed to fuel the next leg in price. Keep in mind we have key UK inflation data on tap tomorrow – watch the weekly close here for guidance. Review my latest British Pound Weekly Forecast for a closer look at the longer-term GBP/USD trade levels.
Key GBP/USD Economic Data Releases

Economic Calendar - latest economic developments and upcoming event risk.
Active Short-term Technical Charts
- Australian Dollar Short-term Outlook: AUD/USD Plunges Post-CPI
- Gold Short-term Outlook: XAU/USD Bulls Attempt to Secure 2300
- Canadian Dollar Short-term Outlook: USD/CAD Snap Back- Bears Eye 1.35
- US Dollar Short-term Outlook: USD Bulls March into April
- Euro Short-term Technical Outlook: EUR/USD Erases Fed Rally
--- Written by Michael Boutros, Sr Technical Strategist with FOREX.com
Follow Michael on X @MBForex


