
British Pound Technical Outlook: GBP/USD Short-Term Trade Levels
- Sterling's rejection from major resistance has reversed the October recovery with price breaking to a fresh yearly low.
- A weekly close below the June low would keep the bears in control and raise the risk of a deeper correction into year-end.
- GBP/USD weekly RSI has fallen to its weakest reading since January 2025, signaling stretched downside momentum.
- Bulls need to reclaim the weekly range high to strengthen the case for a more meaningful recovery.
- Event risk: UK retail sales and flash PMIs are on tap ahead of next week’s U.S. GDP and Core PCE inflation data.
- Resistance 1.3140, 1.3194, 1.3225 (key) - Support 1.3045, 1.3010, 1.2946/65 (key)
The British Pound has come under renewed pressure after the October recovery failed to overcome a major resistance confluence, leaving GBP/USD vulnerable heading into the final stretch of November. The subsequent reversal has weakened the broader technical structure, with sellers now challenging a series of longer-term price levels that have previously marked significant turning points. While the immediate outlook remains tilted to the downside, increasingly stretched momentum raises the prospect of a near-term exhaustion low. The focus now shifts to whether sellers can sustain the latest breakdown or whether the bulls can stabilize the decline as Sterling approaches the next major support zone. Battle lines drawn on the GBP/USD short-term technical charts.
Review my latest Weekly Strategy Webinar for an in-depth breakdown of this Sterling technical setup and more. Join live on Monday’s at 8:30am EST. Join me live Mondays at 8:30am EST and tune in to the Opening Bell Tuesday through Friday at 9:30am EST for continued market coverage throughout the week. All episodes are archived on my YouTube Playlist.
British Pound Price Chart – GBP/USD Daily
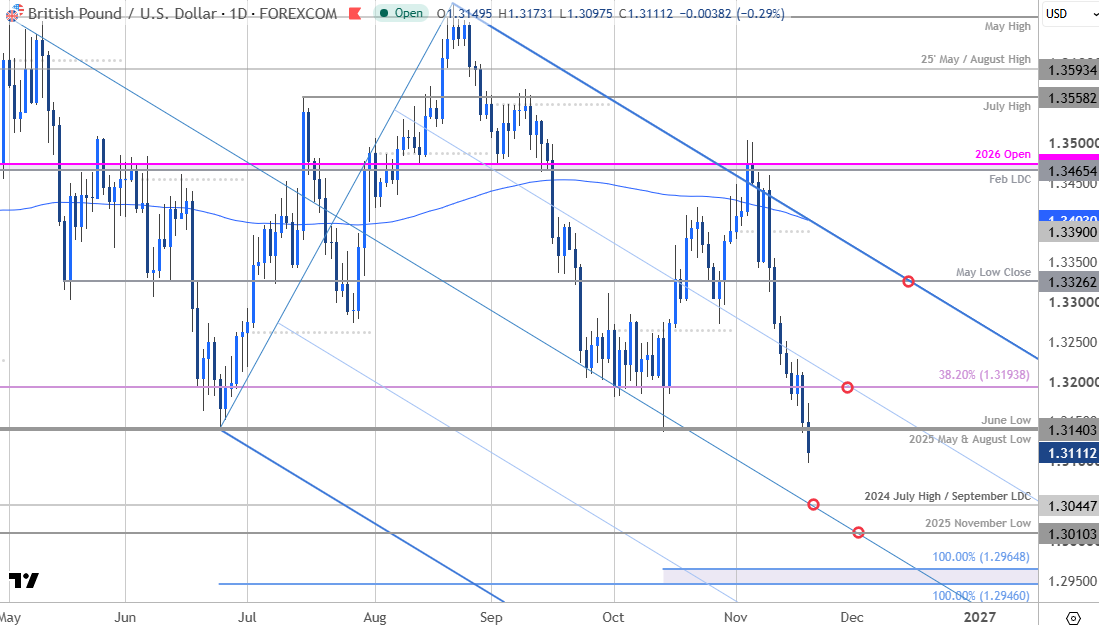
Chart Prepared by Michael Boutros, Sr. Technical Strategist; GBP/USD on TradingView
Technical Outlook: Sterling rallied nearly 2.8% from the October lows and despite a brief stint above the August pitchfork, the bulls were unable to mark a daily close above critical resistance at the February low-day close (LDC) and the yearly open at 1.3465/74. The subsequent reversal has now extended more than 3% off the monthly high with GBP/USD falling to a fresh yearly low. Weekly RSI has now dropped to the lowest level since January 2025 and keeps the momentum profile in favor of the bears for now.
British Pound Price Chart – GBP/USD 240min
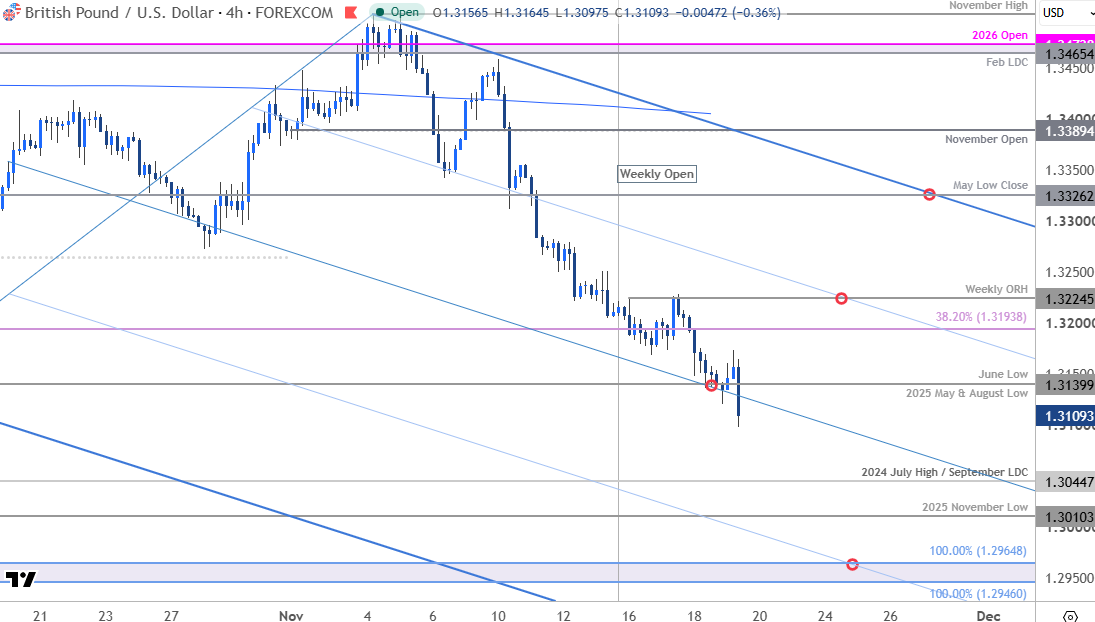 Chart Prepared by Michael Boutros, Sr. Technical Strategist; GBP/USD on TradingView
Notes: A closer look at Sterling price action shows GBP/USD trading within the confines of a descending pitchfork extending monthly high with price now attempting to secure a daily close below the median line. Subsequent support objectives rest with the 2024 July high / September low-day close (LDC) at 1.3045 backed closely by the 2025 November low at 1.3010. The next major technical consideration rests at 1.2946/65- a region is defined by the 100% extension of the broader January decline and the 100% extension of the August selloff. This zone converges on 25% parallel next week. Look for a larger reaction there IF reached.
Initial resistance is now eyed back at 1.3140 where the June low converges on the 2025 May & August lows. Subsequent resistance is eyed at the 38.2% retracement of the 2025 advance at 1.3194 backed closely by the objective weekly opening range high at 1.3225. Broader bearish invalidation is now lowered to the May low-close at 1.3326. This level converges on the upper parallel into the close of the month and a breach / daily close above would be needed to suggest a more significant low is in place, and a larger trend reversal is underway.

Bottom line: GBP/USD has dropped to twelve-month lows with a break of key support threatening further losses in the days ahead. Near-term momentum suggests the decline may be a tad stretched here and the weekly close will be critical. From a trading standpoint, rallies would need to be limited to 1.3225 IF price is heading lower on this stretch – with a weekly close below 1.3140 needed to keep the bears in control heading into next week.
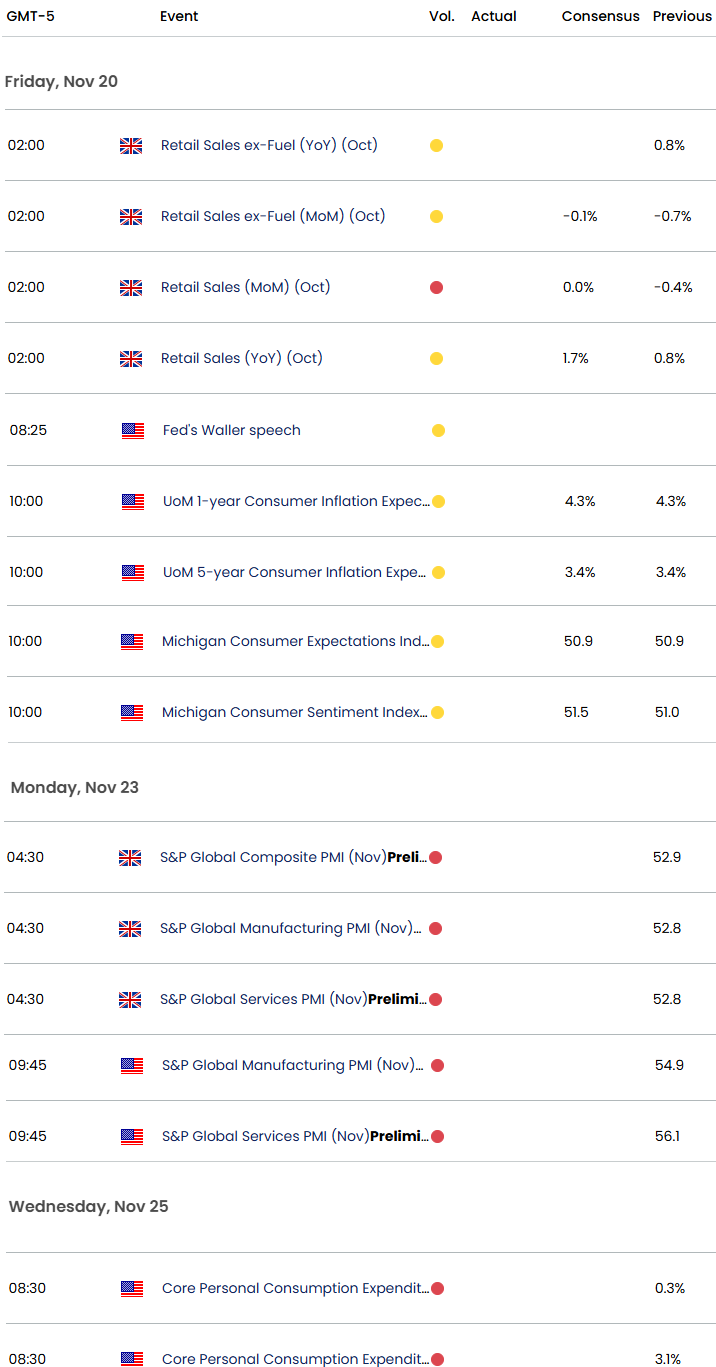
GBP/USD event risk into the weekly close begins with Friday’s U.K. retail sales report, followed by the November flash PMIs on Monday. The data will offer an early read on household demand and business activity as markets continue to price a high probability of another Bank of England hike in December. Attention then shifts to the U.S. side, with the second estimate of third-quarter GDP and October personal income and outlays—including core PCE—due Wednesday. Strong U.S. growth or inflation data could support the dollar and limit GBP/USD upside, while softer figures would leave the pair more sensitive to renewed sterling strength. Keep in mind that thin holiday-week liquidity may amplify the reaction. Stay nimble into the releases and watch the weekly closes for guidance here. Review my latest British Pound Weekly Forecast for a closer look at the longer-term GBP/USD technical trade levels.
Key GBP/USD Economic Data Releases
Active Short-term Technical Charts
- Euro Short-term Outlook: EUR/USD Plunges to 19-Month Low—Bears Face Critical Test
- Gold Price Short-term Outlook: XAU/USD Bears Face Critical Test at Yearly Lows
- Japanese Yen Short-term Outlook: USD/JPY Breakout Hits 10-Week Highs—160 in Focus
- Australian Dollar Short-term Outlook: AUD/USD 3% Plunge Puts Multi-Month Range at Risk
- Canadian Dollar Short-term Outlook: USD/CAD Plunge Stalls at Pivotal Support—Range Break in Focus
- Swiss Franc Short-term Outlook: USD/CHF Selloff Nears Critical Support Ahead of NFP
- US Dollar Short-term Outlook: USD Rally on the Line as Midterms, NFP Loom
--- Written by Michael Boutros, Senior Technical Strategist
Follow Michael on X @MBForex