British Pound Outlook: GBP/USD
GBP/USD gives back the advance from the start of the week even as the UK Consumer Price Index (CPI) unexpectedly holds steady at 6.7% in September, and the exchange rate may struggle to retain the advance from the monthly low (1.2037) amid the failed attempt to trade back above the former support zone around the May low (1.2308).
British Pound Forecast: GBP/USD Rebound Stalls at Former Support Zone
GBP/USD seems to be stuck in a narrow range after registering a fresh monthly high (1.2338) during the previous week, and the exchange rate may hold steady over the remainder of the month as the stronger-than-expected UK CPI report puts pressure on the Bank of England (BoE) to further combat inflation.
Join David Song for the Weekly Fundamental Market Outlook webinar. David provides a market overview and takes questions in real-time. Register Here
UK Economic Calendar

However, the UK Retail Sales report may keep the BoE on the sideline as household spending is expected to contract 0.1% in September, and indications of a slowing economy may spur a greater dissent within the Monetary Policy Committee (MPC) as the ‘Bank staff now expected GDP to rise only slightly in 2023 Q3.’
In turn, the British Pound may face headwinds ahead of the next BoE meeting on November 2 as ‘past increases in Bank Rate were expected to weigh increasingly on the economy,’ but a better-than-expected UK Retail Sales report may curb the recent decline in GBP/USD as it puts pressure on the BoE to further combat inflation.
With that said, GBP/USD may consolidate over the remainder of the week following the limited reaction to the UK inflation report, but exchange rate may struggle to retain the advance from the monthly low (1.2037) amid the failed attempt to trade back above the former support zone around the May low (1.2308).
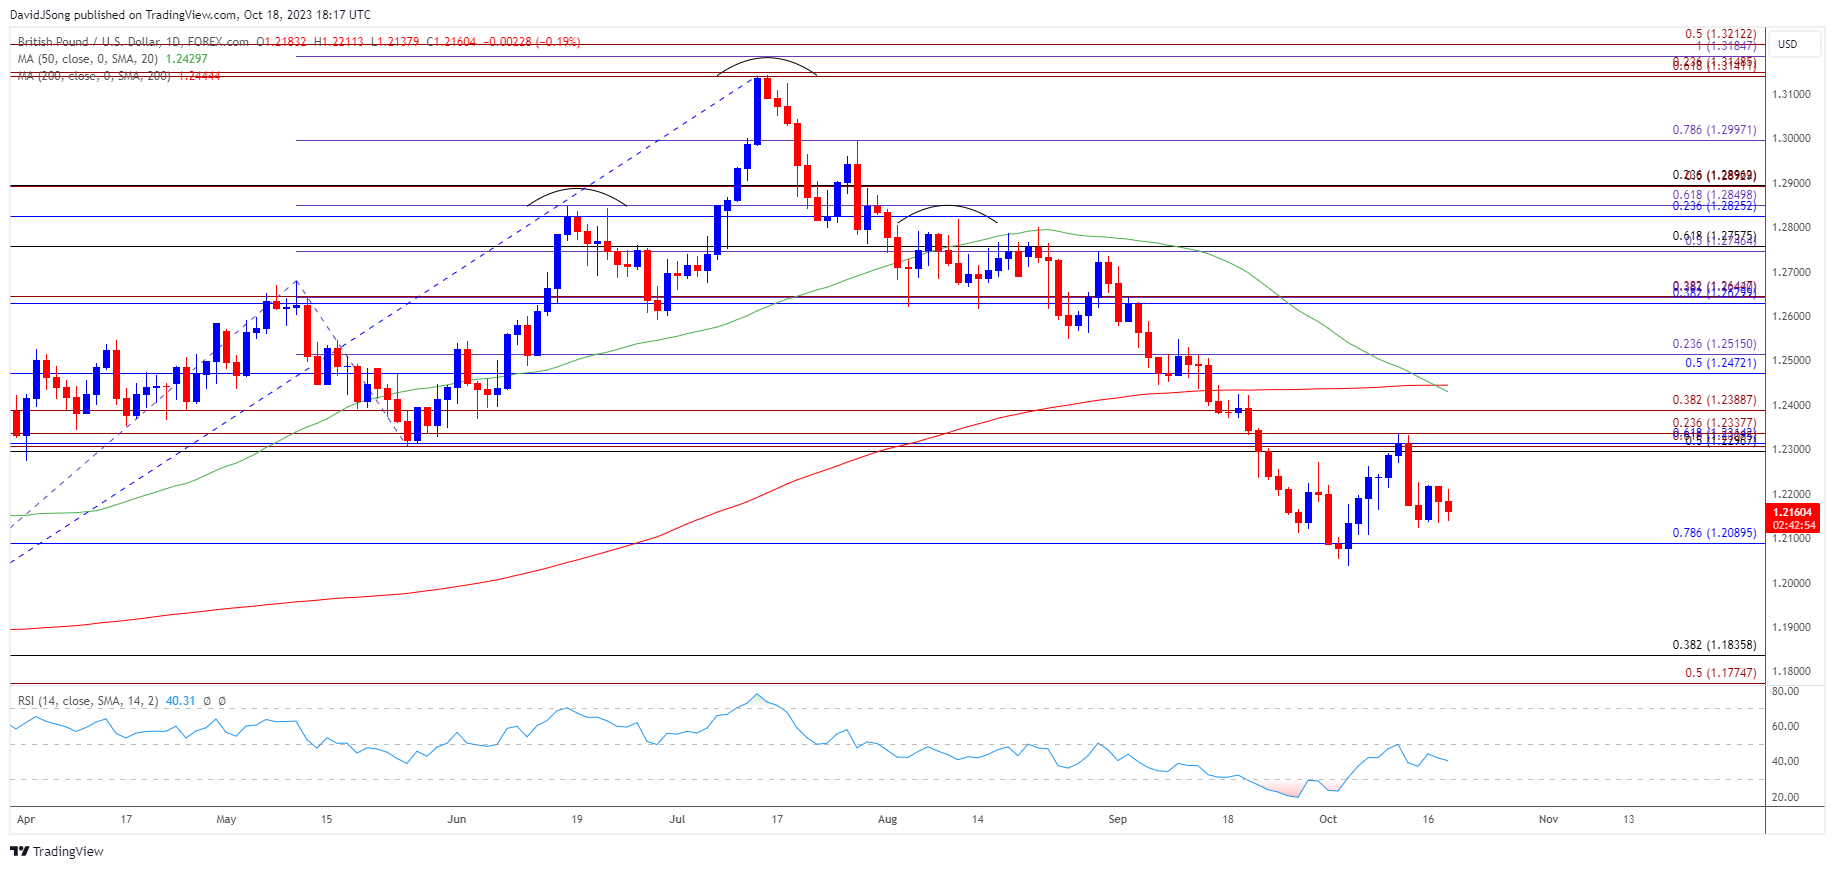
GBP/USD Price Chart –Daily

Chart Prepared by David Song, Strategist; GBP/USD on TradingView
- GBP/USD trades in a narrow range after breaking out of the opening range for October, and the exchange rate may continue to trade sideways as long as it holds above 1.2090 (78.6% Fibonacci retracement).
- However, failure to defend the monthly low (1.2037) may push GBP/USD towards the 1.1780 (50% Fibonacci extension) to 1.1840 (38.2% Fibonacci retracement) region, which incorporates the yearly low (1.1803).
- At the same time, a move above the former support zone around the May low (1.2308) may lead to a near-term rebound in GBP/USD, with a break/close above the 1.2300 (50% Fibonacci retracement) to 1.2390 (38.2% Fibonacci extension) area raising the scope for a test of the 50-Day SMA (1.2429).
Additional Market Outlooks
USD/CAD Rebounds Ahead of 50-Day SMA amid Slowdown in Canada CPI
Australian Dollar Forecast: AUD/USD Enclosed in Monthly Opening Range
--- Written by David Song, Strategist
Follow on Twitter at @DavidJSong


