US Dollar Outlook: GBP/USD
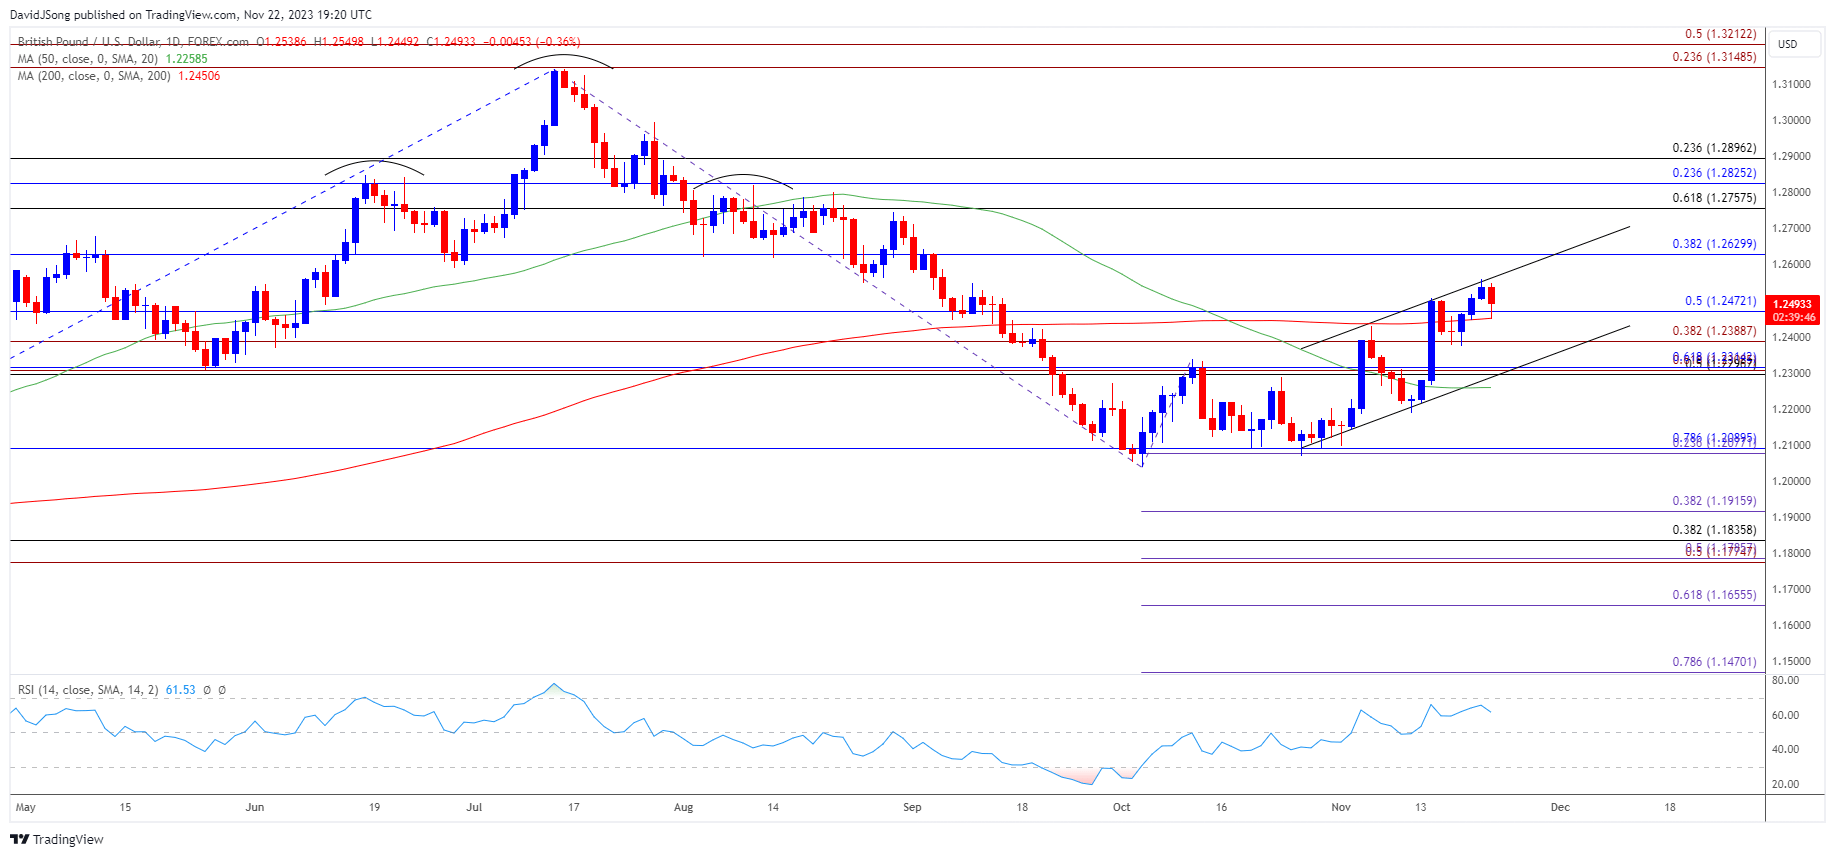
GBP/USD snaps the recent series of higher highs and lows as it pulls back from a fresh monthly high (1.2559), and the exchange rate may continue to give back the advance from the start of November as it appears to be reacting to channel resistance.
British Pound Forecast: GBP/USD Pulls Back from Channel Resistance
Join David Song for the Weekly Fundamental Market Outlook webinar. David provides a market overview and takes questions in real-time. Register Here
GBP/USD seems to be trading within an ascending channel as it no longer responds to the negative slope in the 50-Day SMA (1.2258), but the exchange rate may consolidate over the remainder of the month if it fails to defend the weekly low (1.2446).
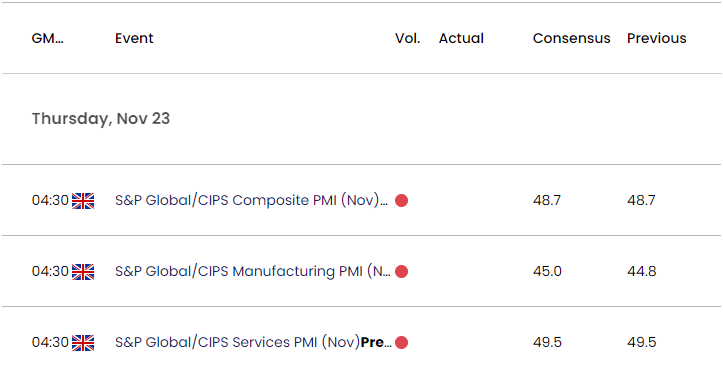
UK Economic Calendar

Looking ahead, data prints coming out of the UK may sway GBP/USD as the Purchasing Managers Index (PMI) for manufacturing and service-based activity are expected to hold below 50 to reflect a contraction in both sectors.
Signs of a slowing economy may produce headwinds for the British Pound as it encourages the Bank of England (BoE) to keep UK interest rates on hold, but a positive development may prop up GBP/USD as it raises the central bank’s scope to further combat inflation.
With that said, GBP/USD may attempt to further retrace the decline from the September high (1.2713) as it appears to be trading within an ascending channel, but the exchange rate may consolidate over the remainder of the month as it pulls back from channel resistance.
GBP/USD Price Chart –Daily

Chart Prepared by David Song, Strategist; GBP/USD on TradingView
- An ascending channel seems to have taken shape as GBP/USD extends the advance from the start of the month, but the exchange rate may continue to fall back from channel resistance as it snaps the recent series of higher highs and lows.
- At the same time, the Relative Strength Index (RSI) may show the bullish momentum abating as it reverses ahead of overbought territory, with a breach below the weekly low (1.2446) raising the scope for a move towards the 1.2300 (50% Fibonacci retracement) to 1.2390 (38.2% Fibonacci extension) region.
- Nevertheless, the recent weakness in GBP/USD may end up short-lived if it defends the weekly low (1.2446), with a break/close above 1.2630 (38.2% Fibonacci retracement) raising the scope for a move towards the September high (1.2713).
Additional Market Outlooks
USD/CAD Forecast: Another Test of Positive Slope in 50-Day SMA
US Dollar Forecast: USD/JPY Selloff Brings Test of October Low
--- Written by David Song, Strategist
Follow on Twitter at @DavidJSong


