British Pound Outlook: GBP/USD
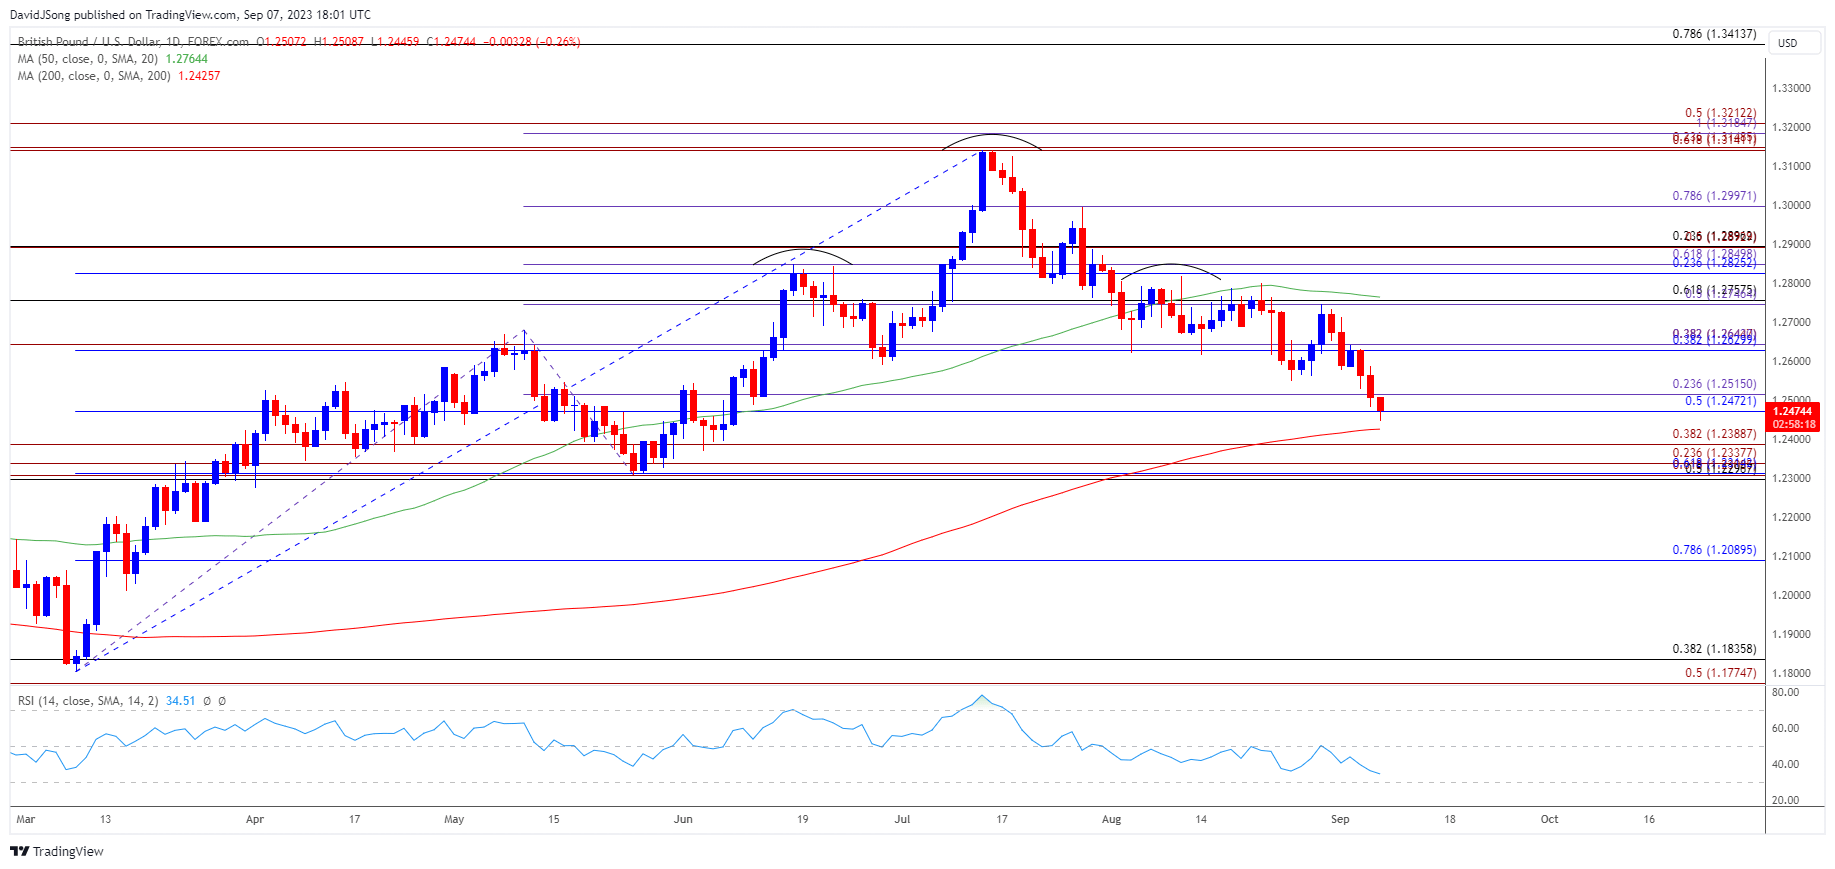
GBP/USD extends the decline from the start of the month to take out the August low (1.2548), and the exchange rate may attempt to test the June low (1.2369) as a head-and-shoulders pattern appears to be unfolding.
British Pound Forecast: GBP/USD Head-and-Shoulders Pattern Unfolds
GBP/USD extends the series of lower highs and lows from earlier this week to register a fresh monthly low (1.2446), and there appears to be a potential change in trend as the 50-Day SMA (1.2764) no longer reflects a positive slope.
As a result, a further decline in GBP/USD may push the Relative Strength Index (RSI) into oversold territory for the first time this year as the oscillator falls towards 30, and data prints coming out of the UK may do little to shore up the British Pound should the UK Employment report show another contraction in job growth.
Join David Song for the Weekly Fundamental Market Outlook webinar. David provides a market overview and takes questions in real-time. Register Here
UK Economic Calendar

A second consecutive decline in UK Employment may produce headwinds for the British Pound as its casts a weakened outlook for growth, and signs of a slowing economy may generate a greater dissent within the Bank of England (BoE) as the central bank denotes a ‘market-implied path for Bank Rate that rises to a peak of just over 6%.’
As a result, the BoE may adjust the forward guidance at its next meeting on September 21 as ‘the current monetary policy stance was restrictive,’ but a rebound in UK job growth may push the Monetary Policy Committee (MPC) to further embark on its hiking-cycle as the central bank plans to ‘ensure that Bank Rate was sufficiently restrictive for sufficiently long to return inflation to the 2% target sustainably in the medium term.’
Until then, speculation surrounding monetary policy in the UK and US may sway GBP/USD as the Federal Reserve also keeps the door open to implement higher interest rates, but the opening range for September raises the scope for a further decline in the exchange rate as it extends the series of lower highs and lows from earlier this week.
With that said, GBP/USD may continue to give back the advance from the June low (1.2369) as a head-and-shoulders pattern appears to be unfolding, and a further decline in the exchange rate may push the Relative Strength Index (RSI) into oversold territory for the first time this year as the oscillator falls towards 30.
GBP/USD Price Chart –Daily

Chart Prepared by David Song, Strategist; GBP/USD on TradingView
- A head-and-shoulders pattern appears to be unfolding as GBP/USD extends the decline from the start of the month, and the exchange rate may attempt to test the June low (1.2369) as it extends the series of lower highs and lows from earlier this week.
- Recent developments in the 50-Day SMA (1.2764) warns of a potential change in trend as it no longer reflects a positive slope, with a breach below the 1.2300 (50% Fibonacci retracement) to 1.2390 (38.2% Fibonacci extension) region bringing the April low (1.2275) on the radar.
- A further decline in GBP/USD may push the Relative Strength Index (RSI) into oversold territory for the first time this year as the oscillator falls towards 30, with the next area of interest coming in around 1.2090 (78.6% Fibonacci retracement).
- However, failure to close below the 1.2470 (50% Fibonacci retracement) to 1.2520 (23.6% Fibonacci extension) zone may curb the bearish price series in GBP/USD, with a move above the 1.2640 (38.2% Fibonacci extension) to 1.2650 (38.2% Fibonacci extension) region raising the scope for a test of the monthly high (1.2713).
Additional Market Outlooks
USD/CAD Post-BoC Rise Pushes RSI Towards Overbought Zone
AUD/USD Forecast: RSI Susceptible to Another Oversold Reading
--- Written by David Song, Strategist
Follow on Twitter at @DavidJSong


