British Pound Technical Forecast: GBP/USD Weekly Trade Levels
- British Pound attempting to snap three-week losing streak- off nearly 2% from June high
- GBP/USD bulls vulnerable below multi-year slope resistance- US Core PCE on tap into monthly cross
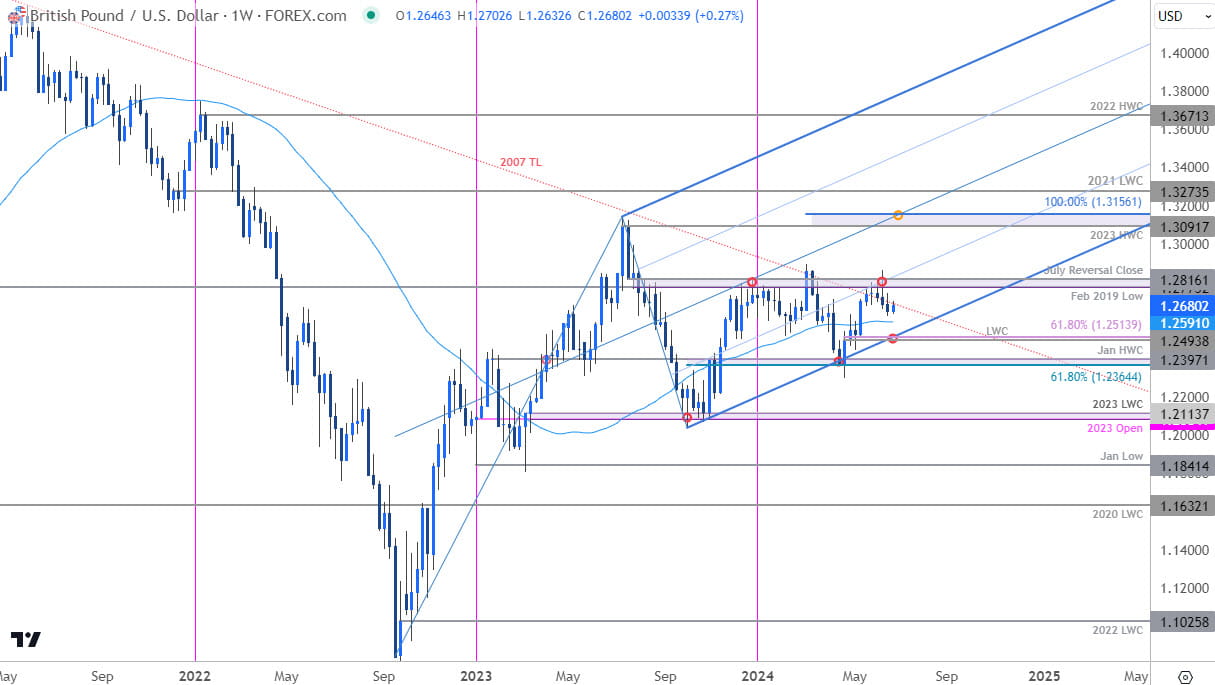
- Resistance 1.2773-1.2816 (key), 1.2893, 1.3091-1.3156 – Support ~1.2591, 1.2493-1.2514 (key), 1.2364/97
The British Pound is getting a reprieve from a three-week sell-off with GBP/USD up just 0.27% since the start of the week. The bulls remain on the defensive after turning from key resistance this month and the focus now shifts to key US inflation data into the close of the month / quarter. These are the updated targets and invalidation levels that matter on the GBP/USD weekly chart heading into June trade.
Review my latest Weekly Strategy Webinar for an in-depth breakdown of this Sterling setup and more. Join live on Monday’s at 8:30am EST.
British Pound Price Chart – GBP/USD Weekly

Chart Prepared by Michael Boutros, Sr. Technical Strategist; GBP/USD on TradingView
Technical Outlook: In last month’s British Pound Weekly Forecast we noted that a, “4% rally off the yearly lows is now testing a major resistance pivot near the yearly highs. Risk for topside exhaustion / price inflection into the 1.28-handle. From a trading standpoint, a good zone to reduce portions of long-exposure / raise protective stops.” Price briefly registered an intraweek high at 1.2860 before reversing sharply with a two-week decline shedding more than 1.8%. Sterling is poised to snap a three-week losing streak, but the recovery remains vulnerable while below the 2007 trendline (red).
Key resistance remains with the February 2019 low / July reversal-close at 1.2773-1.2816- a breach / weekly close above this threshold is needed suggest a larger breakout is underway. Note that a close above the objective yearly opening-range highs at 1.2893 would shift the focus towards a late third/fourth quarter high and exposes a possible run towards the next major resistance level at the 2023 high-week close (HWC) / 100% extension of the October advance at 1.3091-1.3156.
Initial support rests with the 52-week moving average (~1.2590) and is backed by a key technical confluence at 1.2493-1.2514- a region defined by the 2024 low-week close (LWC) and the 61.8% Fibonacci retracement of the October advance. A break / weekly close below this threshold would be needed to invalidate the October uptrend with such a scenario exposing the next support level near the yearly close low at 1.2364/97- look for a larger reaction there IF reached for guidance.
Bottom line: Sterling has responded to confluent resistance with a three-week decline taking price just above the yearly moving average. From a trading standpoint, the threat for a deeper pullback remains while below multi-year slope resistance. That said, we are on the lookout for a possible exhaustion low while above 1.2493 IF price is heading higher on this stretch with a breach/close above 1.2816 needed to fuel the next major leg in price.
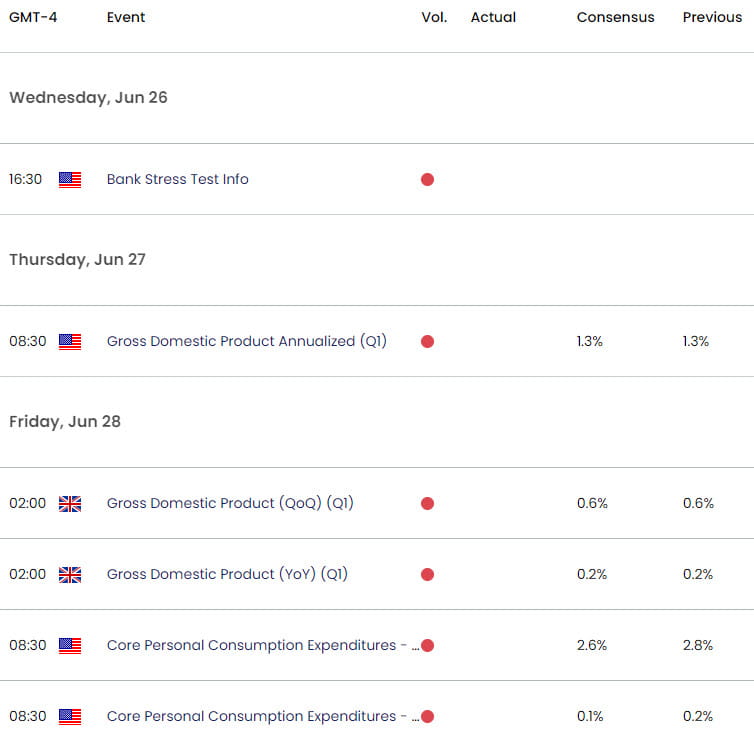
Keep in mind we get the release of key US inflation data (Core PCE) into the close of the week / month – stay nimble into the July open and watch the weekly closes here for guidance. Review my latest British Pound Short-term Outlook for closer look at the near-term GBP/USD technical trade levels.
GBP/USD Economic Data Releases

Economic Calendar - latest economic developments and upcoming event risk.
Active Weekly Technical Charts
- Crude Oil (WTI)
- Australian Dollar (AUD/USD)
- Canadian Dollar (USD/CAD)
- Japanese Yen (USD/JPY)
- US Dollar Index (DXY)
- Gold (XAU/USD)
- Euro (EUR/USD)
--- Written by Michael Boutros, Sr Technical Strategist with FOREX.com
Follow Michael on X @MBForex


