British Pound Technical Forecast: GBP/USD Weekly Trade Levels
- British Pound rally falters at technical pivot zone- threatens second weekly decline
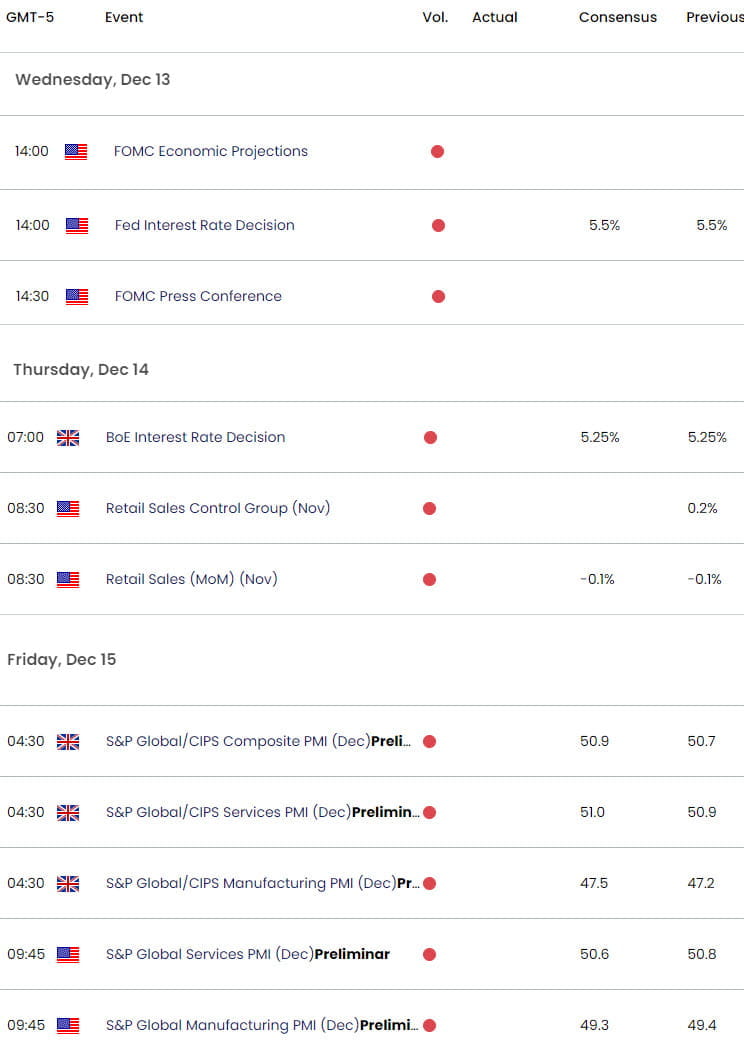
- GBP/USD key support confluence now in view- Fed, BoE interest rate decisions on tap
- Sterling resistance 1.2623, 1.2720/73, 1.2906– Support 1.2397-1.2467, 1.2303, 1.2084-1.2113
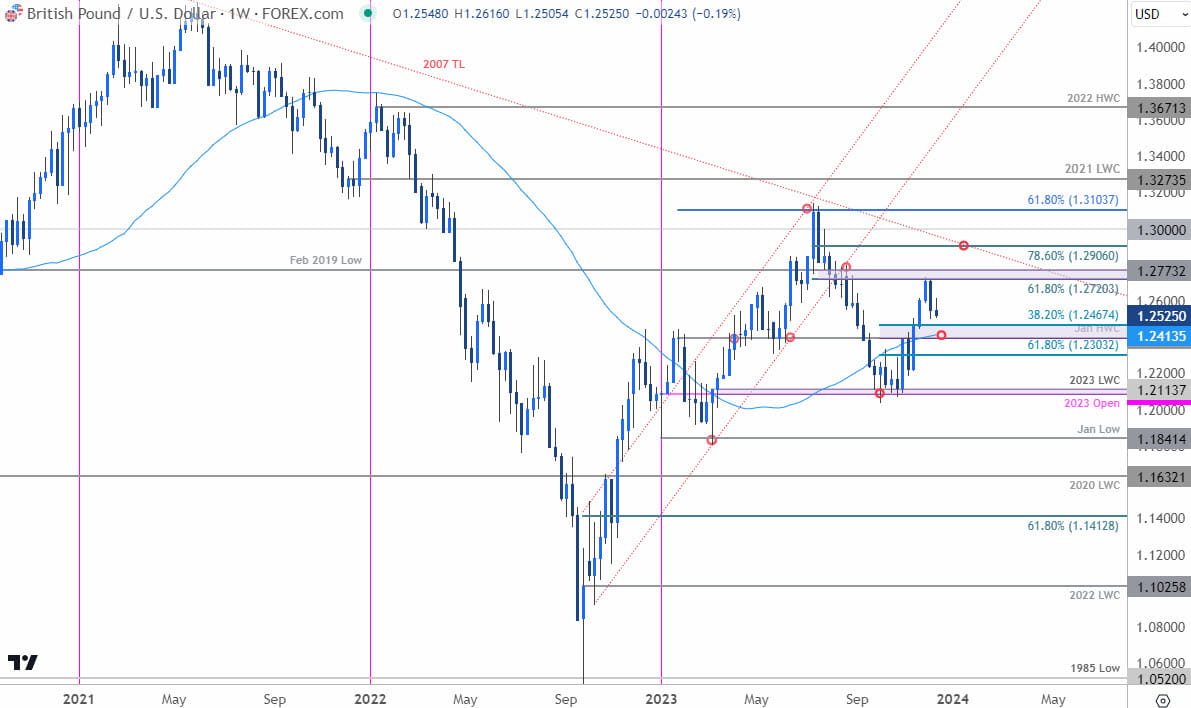
The British Pound remains on the defensive this week with GBP/USD down nearly 1.8% from the November highs. A reversal off technical resistance has fueled the bears with Sterling now within striking distance of a major support-pivot. These are the updated targets and invalidation levels that matter on the GBP/USD weekly chart heading into the Fed and BoE interest rate decisions.
Review my latest Weekly Strategy Webinar for an in-depth breakdown of this Sterling setup and more. Join live on Monday’s at 8:30am EST.
British Pound Price Chart – GBP/USD Weekly

Chart Prepared by Michael Boutros, Sr. Technical Strategist; GBP/USD on TradingView
Technical Outlook: In last month’s British Pound Weekly Forecast we noted that the GBP/USD rally had reached a major inflection zone and that, “losses should be limited to the weekly-open at 1.2226 IF price is heading higher on this stretch with a weekly close above 1.2459 needed to keep the immediate advance viable.” Price continued to rip higher the following week with the rally extending into highlighted resistance at 1.2720/73- a region defined by the 61.8% Fibonacci retracement of the July decline and the February 2019 swing low (high registered at 1.2733). A sizeable reversal candle last week now threatens a deeper pullback towards former resistance and the focus is on possible downside exhaustion in the weeks ahead.
Weekly support now rests at 1.2397-1.2467- a zone that encompasses the January high-week close, the 52-week moving average, and the 38.2% retracement of the October rally. Look for possible inflection there IF reached with a break / close below the 1.23-handle ultimately needed to suggest a larger reversal is underway.
Monthly-open resistance stands at 1.2623 with a topside breach / close above 1.2773 needed to mark uptrend resumption. The next major resistance threshold is eyed at the 2007 slope confluence around the 78.6% retracement near 1.29- an area of interest for possible topside exhaustion IF reached.
Bottom line: The October breakout has reversed of technical resistance with the decline now approaching a key pivot zone. From a trading standpoint, look to reduce short-exposure / lower protective stops on a stretch towards 1.24 – we’re on the lookout for a possible exhaustion low ahead of 1.23 IF Sterling is still heading higher here with a close above 1.2773 needed to fuel the next leg in price. Review my latest British Pound Short-term Outlook for a closer look at the near-term GBP/USD technical trade levels.
GBP/USD Economic Data Releases

Economic Calendar - latest economic developments and upcoming event risk.
Active Weekly Technical Charts
- Japanese Yen (USD/JPY)
- Australian Dollar (AUD/USD)
- Gold (XAU/USD)
- Euro (EUR/USD)
- US Dollar Index (DXY)
- Canadian Dollar (USD/CAD)
--- Written by Michael Boutros, Sr Technical Strategist with FOREX.com
Follow Michael on X @MBForex


