Brazilian Real Talking Points:
- The Brazilian Real strengthened against both the US Dollar and the Euro this week, even as DXY held a support bounce at the 102 level. USD/BRL pushed below the 4.80 support level as EUR/BRL tested below a Fibonacci level at 5.1987.
It was another week of strength for the Brazilian Real, furthering the growth story that’s continued to keep the currency bid. This happened even as the Brazilian Central Bank held rates flat at 13.75% at their rate decision on Wednesday, and there’s even been some expectation building for possible rate cuts later in the year.
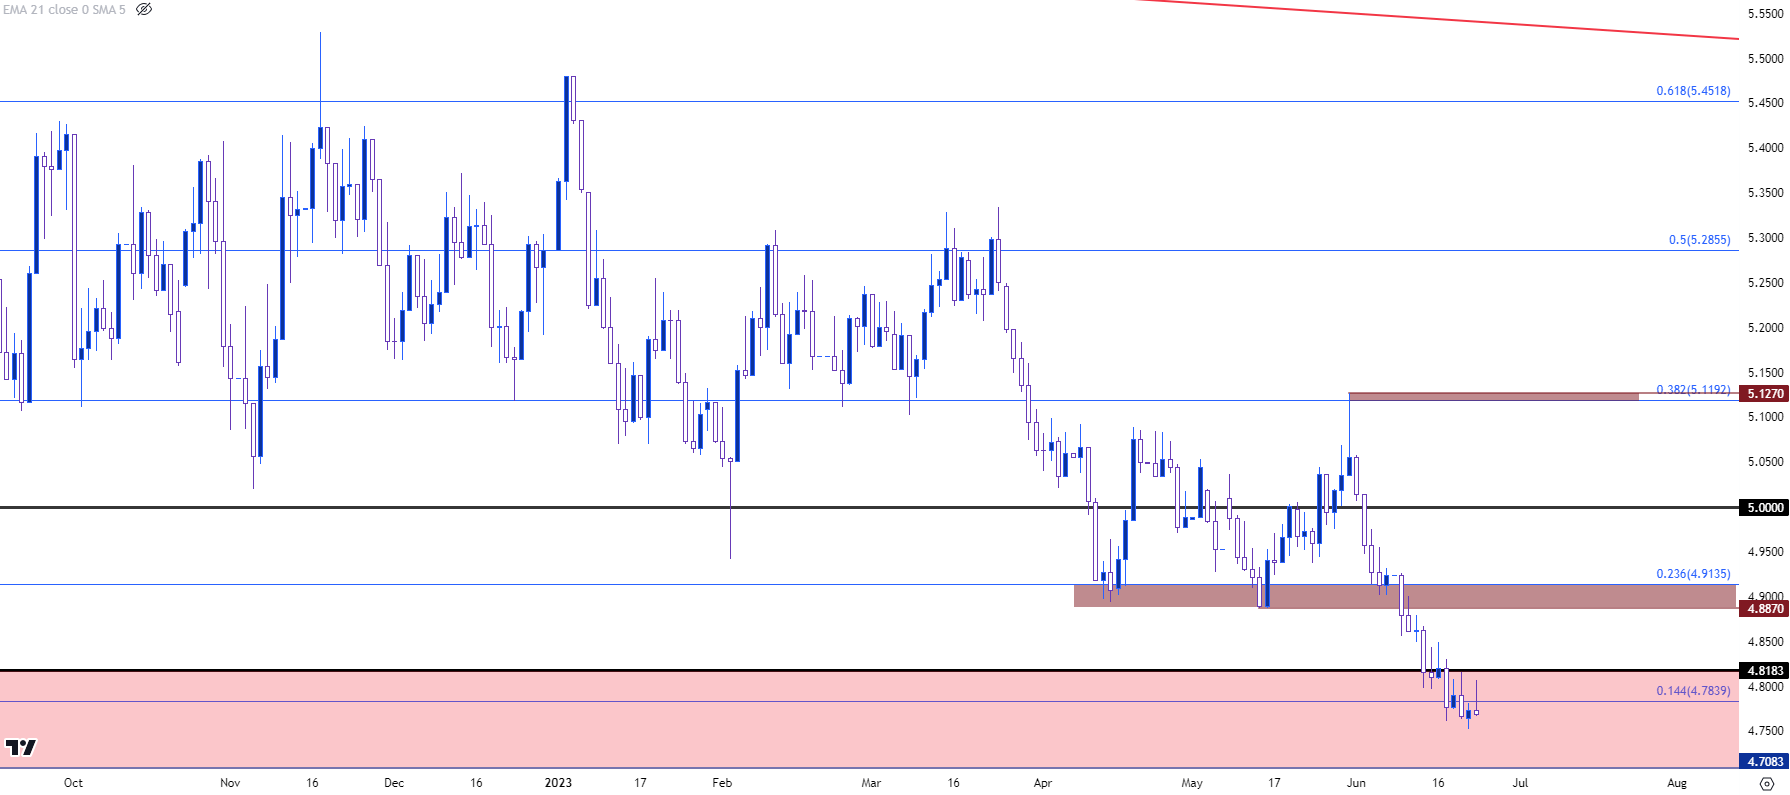
USD/BRL has dropped deeper into the support zone looked at last week which begins around the 4.8183 level, setting another fresh yearly low. This keeps bears in-control of near-term price action with the next significant spot of support at the 4.7083 level.
USD/BRL Weekly Chart
 Chart prepared by James Stanley; USD/BRL via Tradingview
USD/BRL Shorter-Term
On a shorter-term basis we can see the impact of sellers driving into this longer-term support zone. The 4.8183 level helped to hold the Wednesday high that posted on the same day of the rate decision.
This continues the streak of lower-lows and lower-highs that have posted since the June open. The concern at this point, from a shorter-term basis, would be oversold dynamics. But when taken with the fact that this strength in the real showed even during a week when DXY prodded its own bounce could be an item of encouragement for BRL bulls.
If there is a bullish breach above 4.8183 next week, the door opens for a re-test of longer-term support at the zone that runs from 4.8870-4.9135. If sellers can force a push without more of a pullback, a breach of lows exposes the longer-term swing around the 4.7083 level.
USD/BRL Daily Chart
 Chart prepared by James Stanley; USD/BRL via Tradingview
EUR/BRL
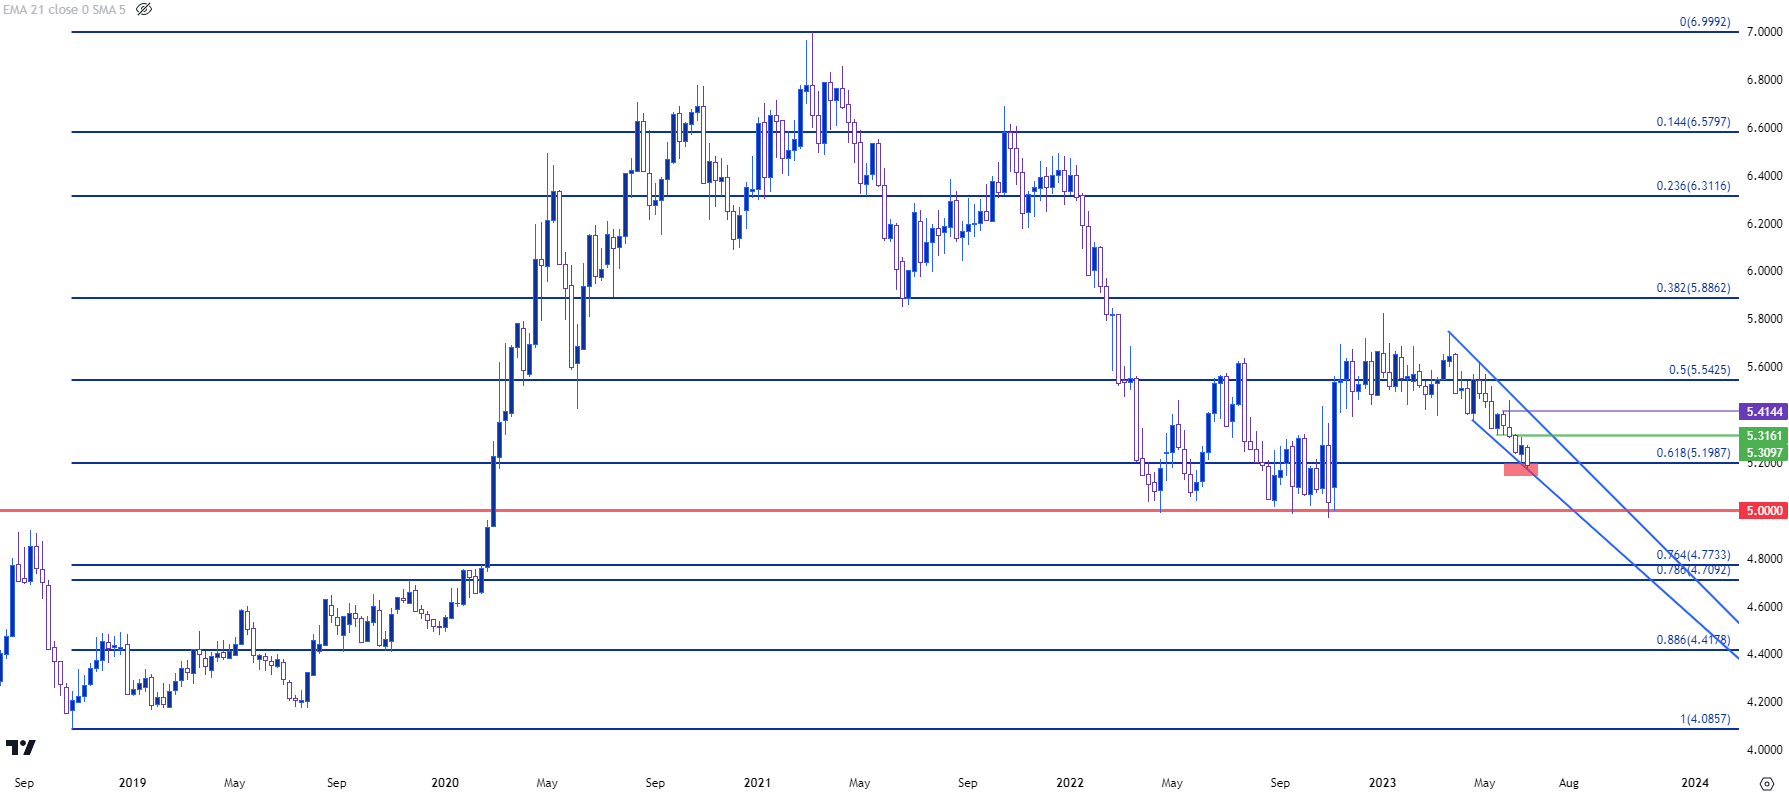
EUR/BRL has the benefit of this week’s Euro weakness to go along with that Real strength, which helped the pair to push down to a fresh eight-month-low. The prior support level at 5.1987 is a key Fibonacci level as the 61.8% retracement of the 2018-2021 major move and this didn’t give way easily, as sellers weren’t able to test below until Friday.
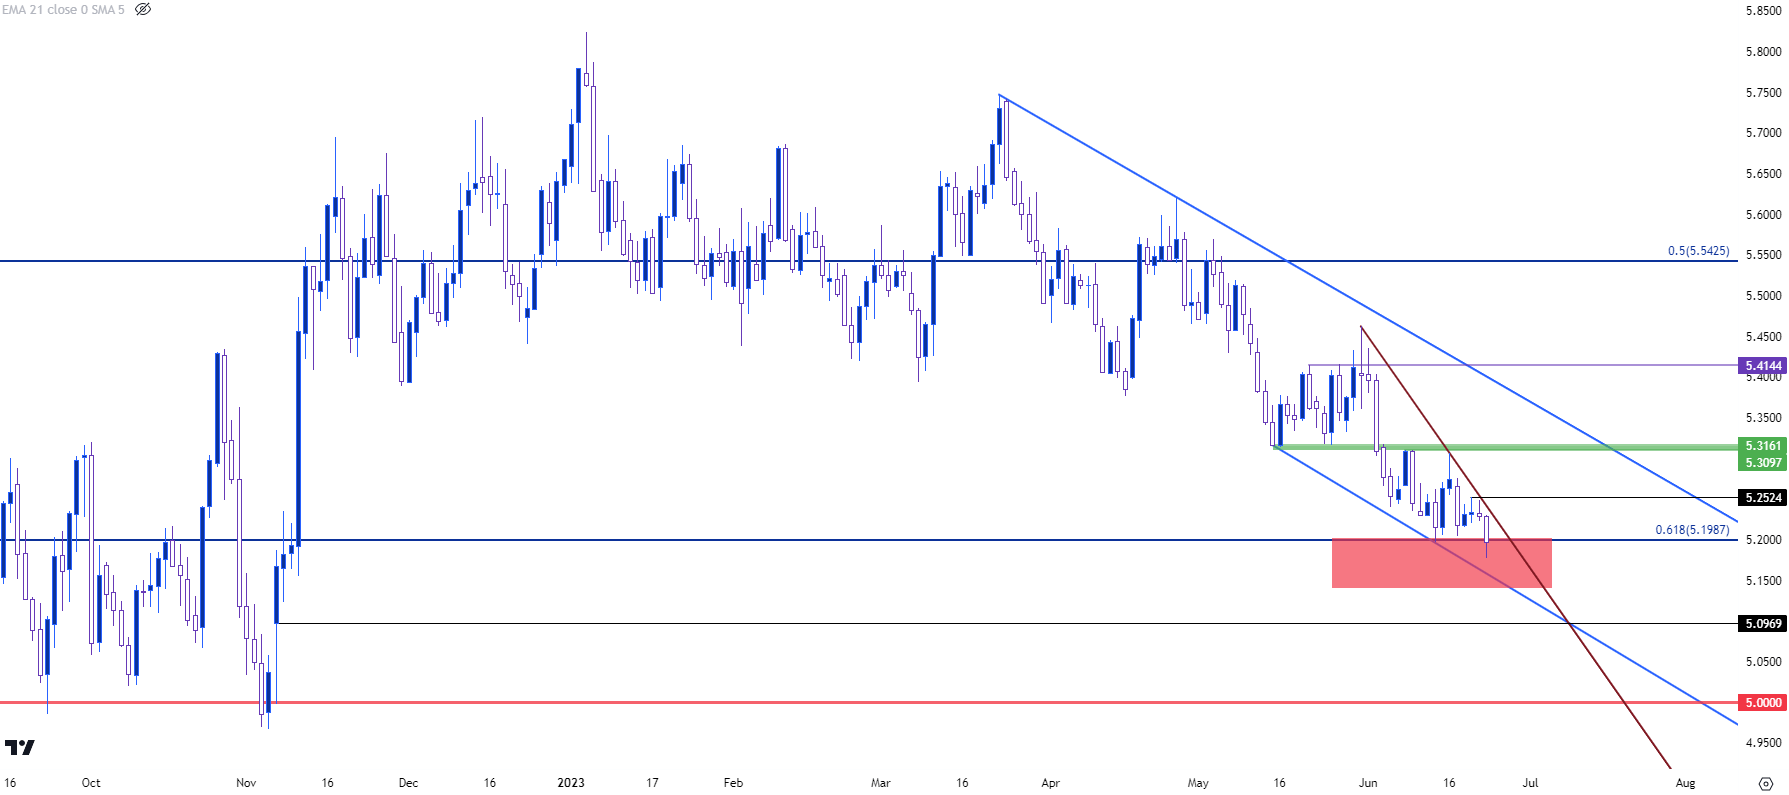
This does keep bears in-control as a fresh low came into play, but more action below 5.1987 will be needed to qualify the matter for bearish trend continuation purposes, which I’ll look at on the shorter-term chart.
From the weekly, the major level of support is around the psychological 5.00 handle, which saw quite a bit of testing last year; with key resistance showing around the 5.31 area.
EUR/BRL Weekly Chart
 Chart prepared by James Stanley; EUR/BRL via Tradingview
EUR/BRL Shorter-Term
The concern here would be oversold dynamics, although price pushing down to a fresh low on Friday, a couple of days after the rate decision, does denote a willingness from bears to test fresh lows. The bigger question is whether they can keep up that pace next week as there’s been a build of a falling wedge which is often approached with aim of bullish reversals. The Wednesday high at 5.25 seems key for this scenario, as a breach above that would also come along with a breakout from the pattern, pointing to the next area of resistance around the 5.31 area.
As for next support – if bears can hold the line the next obvious spot would be around the 5.10 level that was last in-play in November when the pair was moving off of the support that had built in at the psychological 5.00 level.
EUR/BRL Daily Chart
 Chart prepared by James Stanley; EUR/BRL via Tradingview
--- written by James Stanley, Senior Strategist


