Brazilian Real Talking Points:
- The Brazilian Real hit a fresh yearly high against the US Dollar this week, helped along by a Wednesday report from S&P Global that raised outlook for the economy to positive from stable.
- EUR/BRL held a key support level as the European Central Bank pledged to continue hiking rates in effort of stemming inflation. A Fibonacci level came into play on Wednesday and helped to hold the lows in the pair, with continued pullback on Thursday and Friday.
The Brazilian Real came into the week with a full head of steam and continued to show strength against both the Euro and the US Dollar into Wednesday trade. Optimism around recovery continues to keep the Brazilian currency bid and the Wednesday report from S&P Global raising the outlook for the economy helped to further that theme with USD/BRL hitting a fresh yearly low. This continues a visible three-week reversal pattern after the pair failed to hold above the 5.00 handle, which keeps the bearish intermediate-term trend in place on the pair as this week marked yet another lower-low.
USD/BRL
On a longer-term basis from the weekly, USD/BRL retains tendencies of a range as price has been showing mean reversion for much of the past year and half. We’re currently approaching a tenuous spot on the chart below the 4.80 level. We did have a couple of tests below this level last year, but that’s where selling pressure slowed before prices rallied up to a lower-high. The 4.8183 level was in the picture in June of 2020 and it came back into the equation this week on Wednesday to help hold the low into the end of the week.
USD/BRL Weekly Chart

Chart prepared by James Stanley; USD/BRL via Tradingview
USD/BRL Shorter-Term
From the daily chart, there’s an intermediate-term bearish trend still in-play with this week’s lower-low. Prices stalled at that support test at 4.8183 which highlights pullback potential in the bearish trend. There’s a spot of prior support which shows around a Fibonacci level at 4.9135 that remains of interest for lower-high resistance potential. A show of resistance from sellers there keeps the door open for bearish continuations scenarios with focus on a deeper push into the longer-term support zone.
If sellers can’t hold that resistance, the next significant level on the chart is around the 5.00 handle which could similarly function as lower-high resistance potential for the bearish move given the prior swing high at the 5.1270 level.
On the underside of current price action, the next significant area of support potential shows around the 4.7083 level that hasn’t traded in more than a year.
USD/BRL Daily Chart

Chart prepared by James Stanley; USD/BRL via Tradingview
EUR/BRL
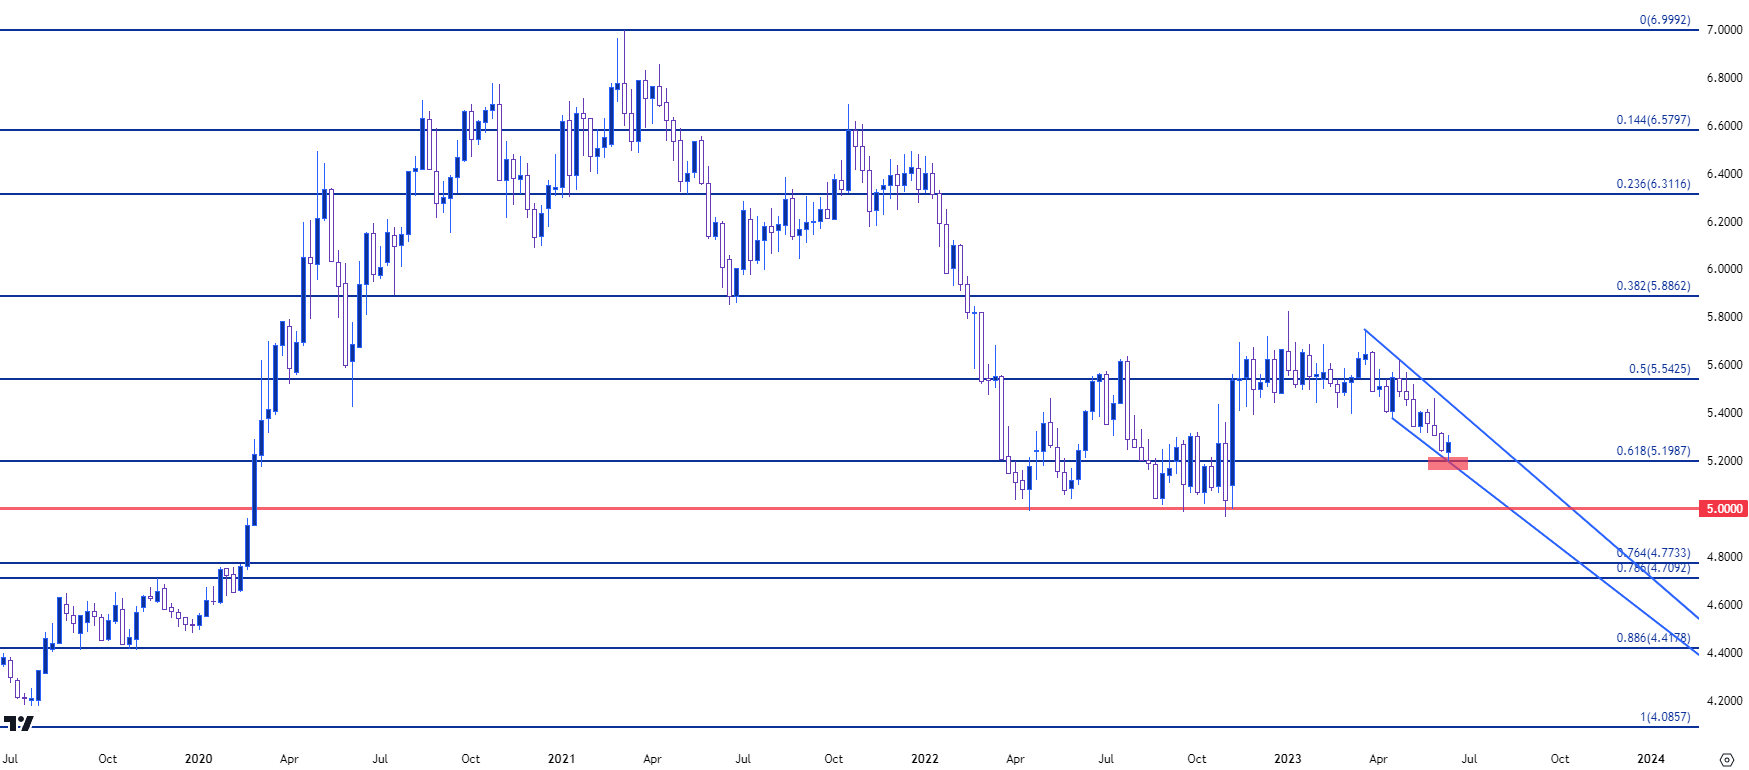
The Euro showed strength against the US Dollar this week following the European Central Bank rate decision and a similar dynamic played out in EUR/BRL. The pair found support at a Fibonacci level on Wednesday, the 61.8% retracement of the 2019-2021 major move, and that set the low for the week with a reversal that followed on Thursday and held into early-Friday trade. This helped the weekly bar to go green in EUR/BRL whereas USD/BRL remained red, highlighting that inter-play between the Euro and US Dollar after rate decisions from each economy.
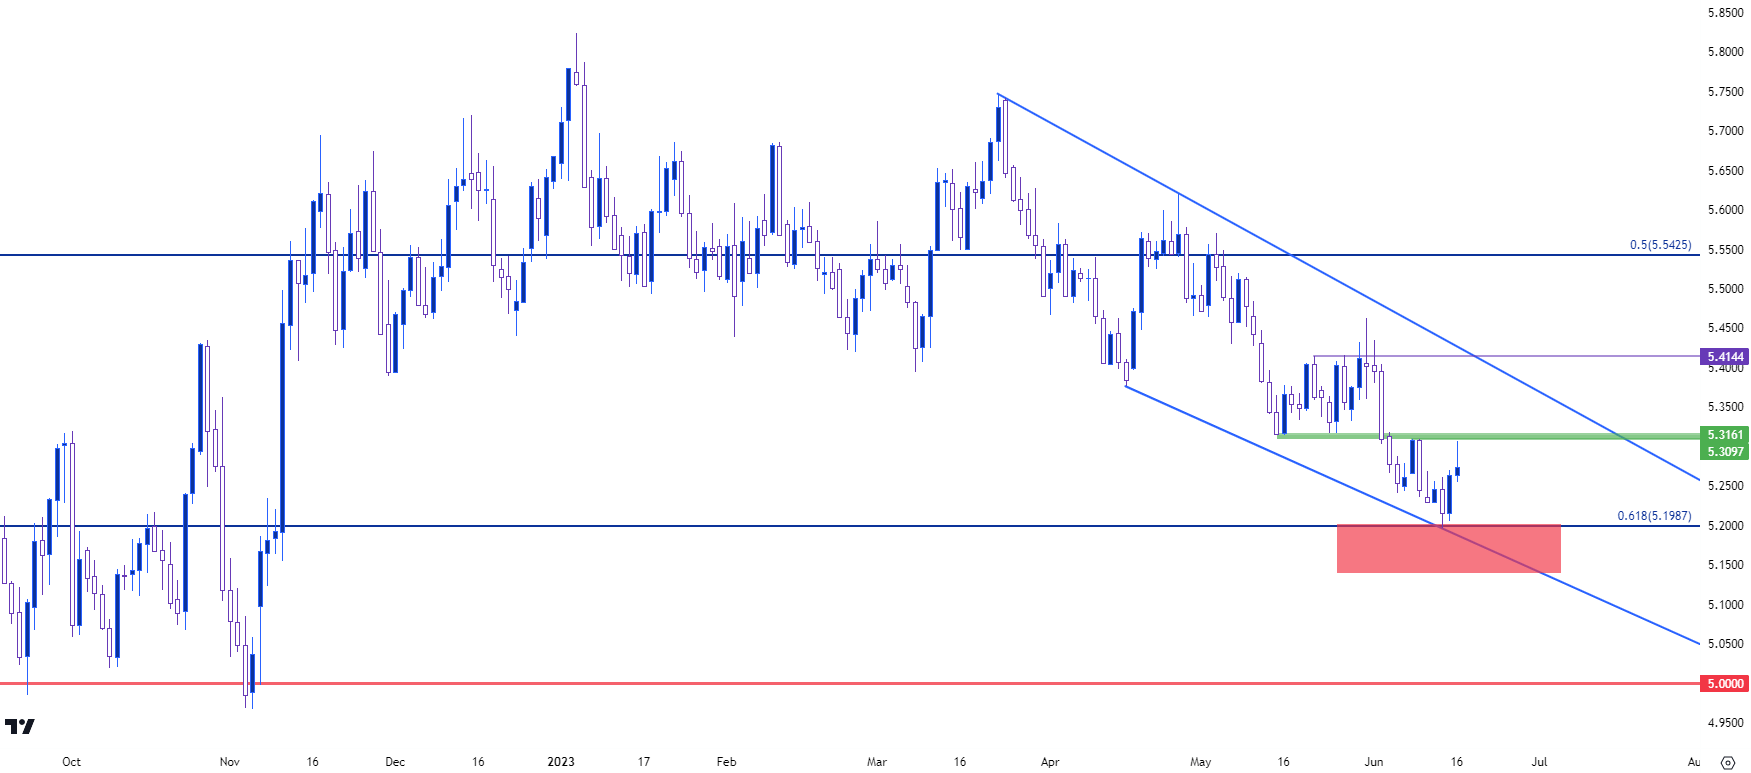
For those looking to fade Real strength, EUR/BRL can perhaps make for a more enticing scenario given current technical backdrop. There’s been a falling wedge build over the past couple of months as sellers have remained aggressive at resistance or near high while showing less aggression near lows or at support. Such formations are often tracked with the aim of bullish reversals, and the possibility for such a scenario does exist but bulls will need to continue to push after the Wednesday support bounce.
EUR/BRL Weekly Chart
 Chart prepared by James Stanley; EUR/BRL via Tradingview
EUR/BRL Shorter-Term
Getting more granular with the matter, there’s a level sitting overhead that bulls will need to contend with, and this is a clear spot of support-turned-resistance around the 5.31 handle. Bulls shied away from a re-test on Friday, but if there is going to be a reversal theme setting up in EUR/BRL, that’s the next major step, substantiating a bullish break above that level. If that scenario plays, the next significant area of resistance is the swing around the 5.41 handle, which is nearing confluent with the upper trendline from the falling wedge formation.
On the bearish side of the pair: A break below 5.1987 denotes failure from bulls and exposes deeper breakdown potential that could run down to the psychological level at the 5.00 handle.
EUR/BRL Daily Price Chart

Chart prepared by James Stanley; EUR/BRL via Tradingview
--- written by James Stanley, Senior Strategist


