Brazilian Real Talking Points:
- It was a relatively quiet week for the real through the lens of EUR/BRL and USD/BRL, the latter of which posted a spinning top on the weekly while the former spent the week building as a doji.
- USD/BRL continues to grind at trendline resistance and with Copom having already started a cutting cycle, any continued pressure on US rate as rate expectations around the Fed could push the bullish breakout theme. EUR/BRL is displaying more of a range-bound state as it has for much of the past two months.
It was relatively calm, all factors considered, as the Brazilian Real went through its first week of trade since Copom kicked off their rate cutting cycle in the opening days of August. That rate cut last week was larger than expected as the bank came in with a 50 bp cut and that helped to prod a run of weakness in the Real in a move that largely held through the week after the cut.
USD/BRL is perhaps the more compelling scenario here as continued strength in US economic data keeps the door open for more rate hikes from the Fed, and this would place the fundamental trajectories behind each currency in the pair at odds as Brazil cuts and the US (possibly) hikes.
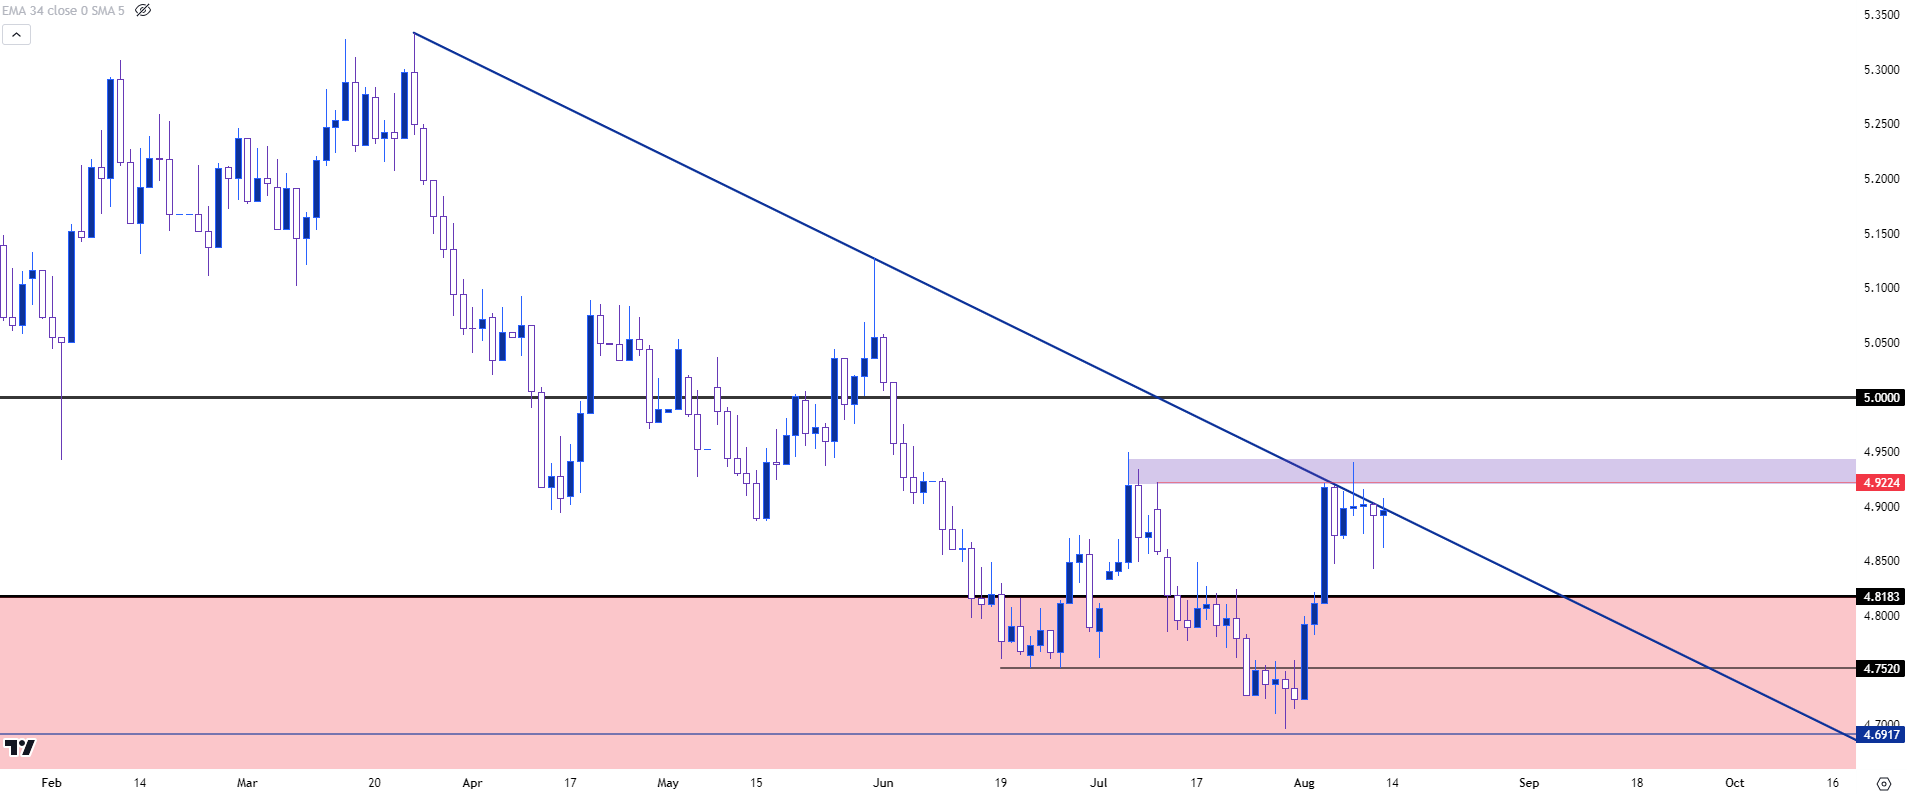
From the daily chart below, we can see the pair bristling for a topside breakout that hasn’t yet taken place. The bearish trendline that I’ve been highlighting in these pieces remains in play and this has traded for each of the past four days.
Reading between the lines there were some items of interest around that trendline this week. Bulls initially tried to push a breakout on Tuesday but were quickly snapped back, which can be seen from the upper wick on that daily bar. After indecision on Wednesday, sellers tried to take control to provoke a deeper pullback but, similarly, they were quickly offset as buyers came back into support the bid and that can be seen from the underside wick on that daily candlestick. That support reaction from bulls pushed price right back to the trendline which remains as resistance as we near the weekend. But, given that dynamic this does keep bulls in the position to push for that topside breach of the trendline that, so far, hasn’t yet given way. And if bulls can push beyond that trendline, it can open the door to bigger picture bullish trend scenarios given the potential for fundamental divergence between the US and Brazil.
The next spot of resistance on the chart is around the psychological level at the 5.00 handle.
USD/BRL Daily Price Chart

Chart prepared by James Stanley; USD/BRL via Tradingview
EUR/BRL
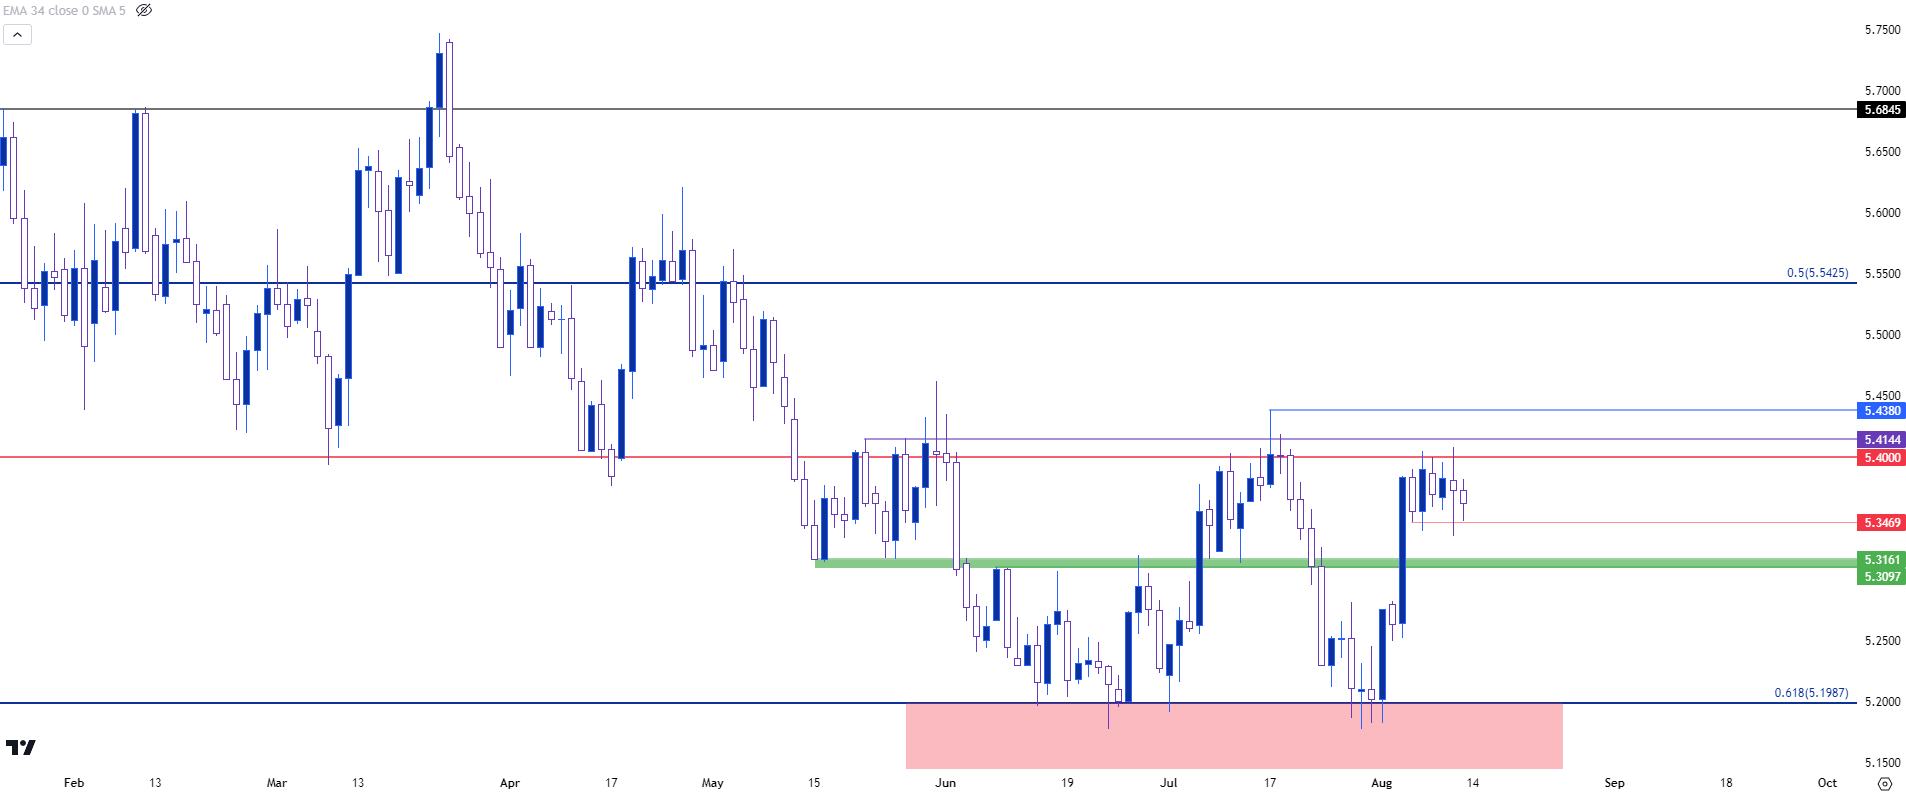
While there remains potential for more hikes out of the US on the back of resilient economic data, that argument in Europe has dimmed of late on the back of slowing economic prints. In-turn the Euro has shown a relative degree of weakness against the US Dollar and that dynamic is on display below in EUR/BRL, as the pair continues to work within a range that’s held over the past couple of months.
That range saw a support test last week just before the rate cut and that helped to propel price back up towards resistance, but the big question here is whether that deviation can continue as there’s been more of a range-bound tendency displaying in this pair.
In EUR/BRL, range resistance has remained around the 5.40 level and that was in play twice over the past week. Short-term support has held around 5.3469 and there’s another spot towards the middle of the range that remains of interest for secondary support, around the 5.31 handle.
To get to the lower half of that range, it would seem as though some additional weakness will need to be seen out of Europe, thereby bringing on some element of rate cuts out of Europe and thereby prodding the single currency lower.
EUR/BRL Daily Price Chart

Chart prepared by James Stanley; EUR/BRL via Tradingview
--- written by James Stanley, Senior Strategist


