Bitcoin has experienced an increase of more than 14% since the last low recorded on January 13. However, the buying momentum has not been strong enough in the short term to sustainably surpass the current resistance barrier at $106k.
The Trump Effect
One of the most significant factors has been the growing popularity of the $TRUMP and $MELANIA cryptocurrencies, which gained over 80% in value over the weekend. This event generated significant enthusiasm, boosting the cryptocurrency market and coinciding with Bitcoin’s short-term upward movements.
On the other hand, as the presidential inauguration day (January 20) approached, the Bitcoin investors remained eager for possible statements from Donald Trump. However, during the inauguration day, there was no mention of the future regulatory environment for cryptocurrencies in the United States. This came as a surprise and contributed to the bearish correction from the $109k level (a new all-time high) to the $104k zone for BTC in recent hours.
It is worth noting that part of the bullish movements in the past two months are based on potential future policies that could benefit the crypto sector under the new administration, including the possible creation of a new Bitcoin national reserve in the United States. If favorable updates from the White House are confirmed, renewed bullish pressure could push Bitcoin to new highs in the short term.
How is Market Confidence?
The Fear and Greed Index for cryptocurrencies currently stands at 59, on the brink of shifting from neutral to greed. This index has risen fast, moving from 46 last week to exceeding the neutral level at 50. This increase reflects a significant growth in market confidence, driven by the dominance of bullish positions in Bitcoin. If the index continues this upward trajectory, buying pressure is likely to remain steady in the short term.
Table: CMC Crypto Fear and Greed Index Behavior

Source: Coinmarketcap
What About Correlation?
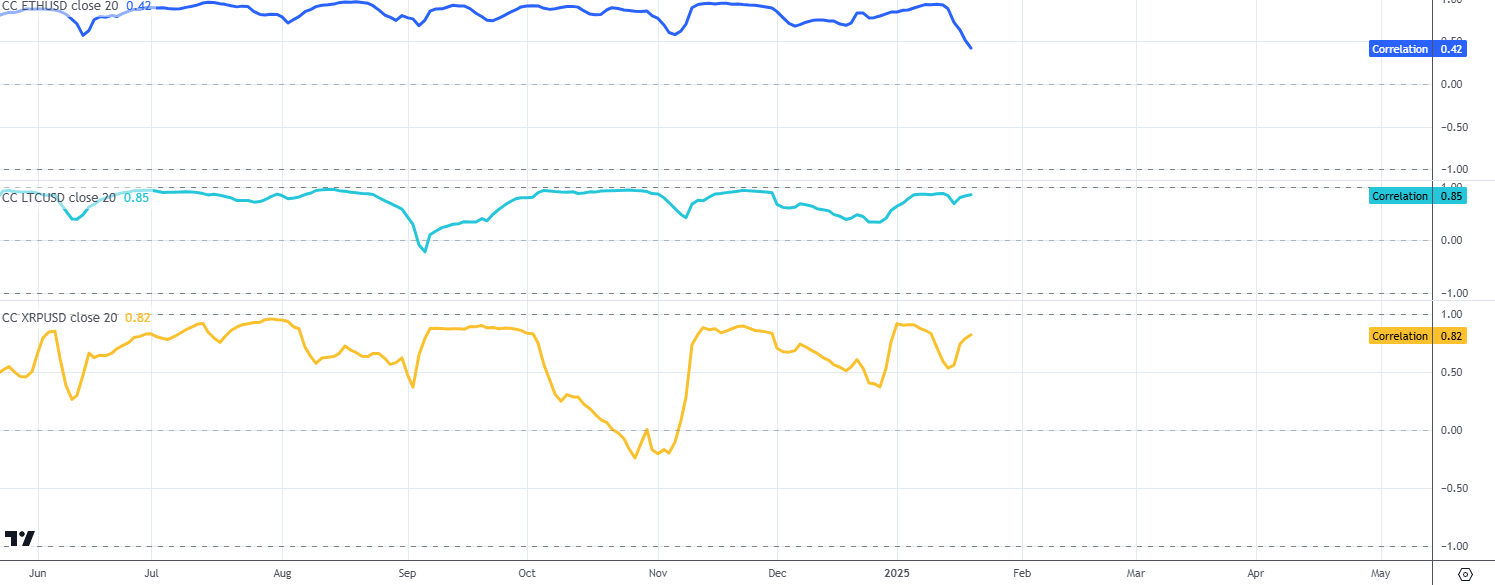
Currently, Bitcoin’s daily movements show a positive correlation coefficient of 85% with Litecoin and 82% with Ripple. However, the correlation with Ether has drastically decreased, dropping from 94% in mid-January to just 42% in recent sessions. While they are correlated at this time, it is important to note that these correlations may change in the future, as past performance is not indicative of future results.

Source: StoneX, Tradingview
The strong positive correlation with Litecoin and Ripple indicates that the buying confidence has also driven bullish movements in these key currencies. On the other hand, the decline in correlation with Ether suggests that the market is prioritizing Bitcoin as the main currency in the crypto environment, thereby reducing demand for the second-largest cryptocurrency. The differences in correlations also imply that, unlike previous years, consistent growth in Bitcoin’s price no longer guarantees similar increases in other cryptocurrencies. As a reminder, while they are correlated at this time, it is important to note that these correlations may change in the future, as past performance is not indicative of future results.
Bitcoin Technical Forecast

Source: StoneX, Tradingview
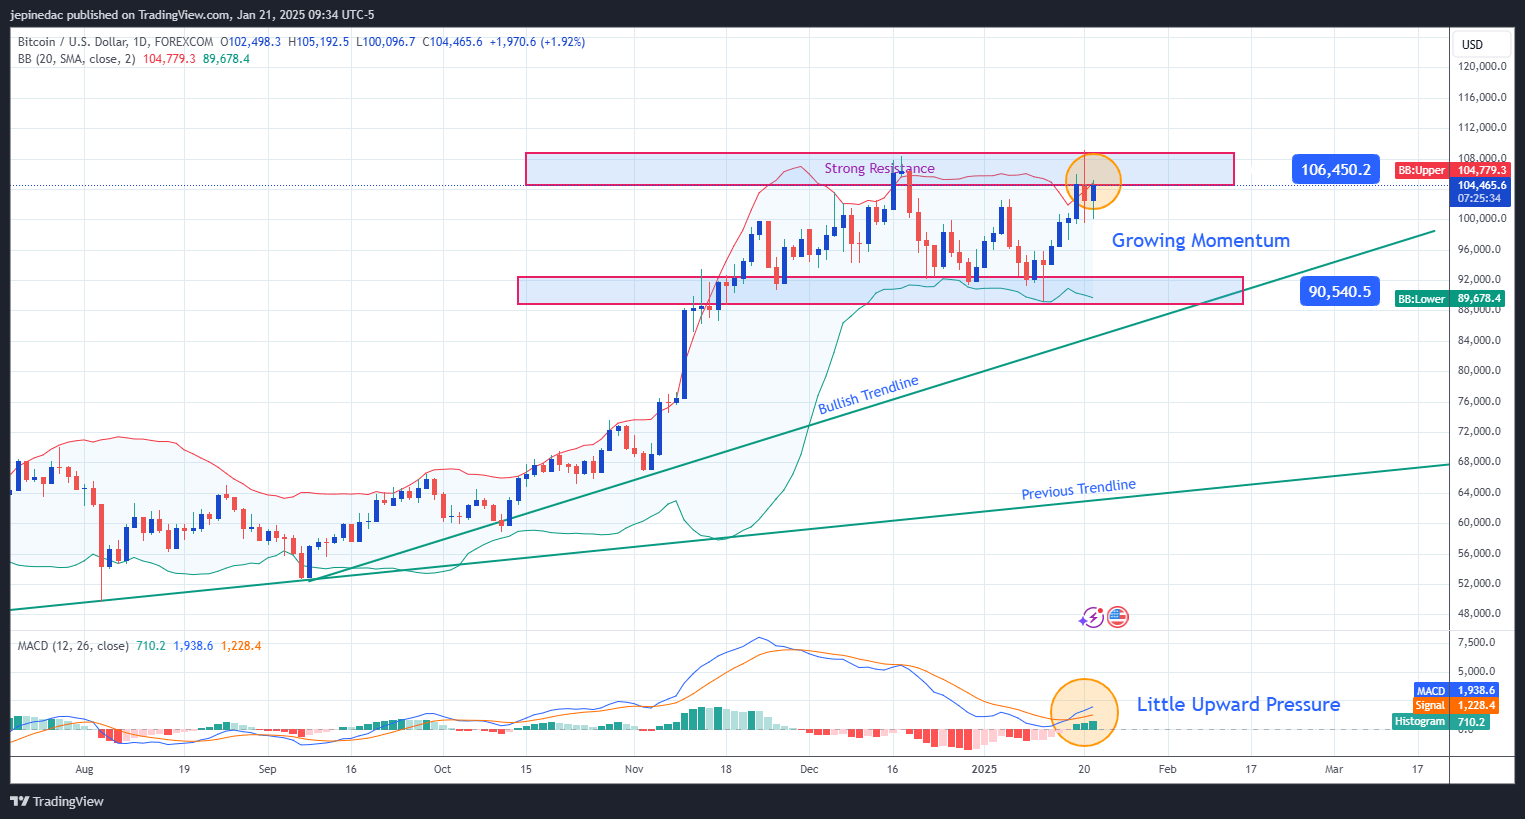
- Consistent Lateral Range: The market shows indecision, forming a short-term lateral range between the ceiling at $106,000 and support at $90,000.
- $106k: This level represents the comfort zone for bullish movements over the past month and coincides with the upper level of the Bollinger Bands. Consistent oscillations above this level could restore confidence and open new opportunities for an upward trend, potentially breaking the current lateral channel.
- $90k: This level acts as a key support for bearish movements and coincides with the lower level of the Bollinger Bands. Selling oscillations that return to this level could generate indecision in the long-term upward trendline and reignite strong selling pressure on BTC prices, potentially maintaining the current lateral range in the long term.
- MACD:
- The signal line and the MACD line show a slightly positive slope above the neutral zone (0).
- The MACD histogram remains oscillating above the 0 level, indicating that recent movements have been predominantly bullish.
The indicator displays that most recent oscillations have stayed in a bullish zone, showing the dominance of buying positions in the market. As the histogram moves further from the neutral line, bullish pressure is likely to intensify. At the moment, there are no extreme signals in the indicator suggesting a significant bearish correction in the short term.
- The signal line and the MACD line show a slightly positive slope above the neutral zone (0).
Written by Julian Pineda, CFA – Market Analyst


