Australian Technical Forecast: AUD/USD Weekly Trade Levels
- Australian Dollar stages massive reversal after briefly registering fresh yearly low
- AUD/USD threat for larger recovery within broader consolidation pattern
- Resistance 6626, 6673/93 6793-6818 (key)- Support 6433, 6335 (key), 6270/83
The Australian Dollar is poised to snap a three-week losing streak with AUD/USD surging nearly 3.8% off fresh yearly lows. An outside weekly-reversal off multi-year trend support now threatens a larger recovery within the 2023 consolidation pattern. Battle lines drawn on the AUD/USD weekly technical chart.
Review my latest Weekly Strategy Webinar for an in-depth breakdown of this Aussie setup and more. Join live on Monday’s at 8:30am EST.
Australian Dollar Price Chart – AUD/USD Weekly

Chart Prepared by Michael Boutros, Sr. Technical Strategist; AUD/USD on TradingView
Technical Outlook: In last month’s Australian Dollar Technical Forecast we noted AUD/USD had, “responded to the first major resistance pivot and while the broader outlook is still constructive, the risk remains of a deeper pullback within the April uptrend. From at trading standpoint, losses should be limited to 6632 IF price is heading higher on this stretch…” Aussie broke lower the following week with price plunging more than 6.6% off the July high to register a fresh yearly low at 6348.
AUD/USD rebounded off trendline support extending off the 2022 lows with price now poised to mark an outside-weekly reversal off the yearly low. The last time Aussie marked an outside-weekly reversal of this magnitude was back in January of 2023- that instance marked the yearly high in Aussie. Another technical factor of interest is the fact that this week marks the largest single-week range since July of last year- that instance marked the monthly high in AUD/USD. This recent defense of support threatens a larger recovery and shifts the focus back towards the multi-month consolidation pattern.
Initial weekly resistance is eyed at the 61.8% Fibonacci retracement of the July decline at 6627 and is backed closely by a more significant technical confluence at 6673/93- a region defined by the 2019 low, the 2008 low-week close (LWC) and the May high-week close (HWC). Look for a larger reaction there IF reached with a breach / weekly close above needed to shift the focus back towards critical consolidation resistance at 6793-6819.
Initial weekly support rests with the April LWC at 6433 and is backed by the objective 2023 LWC at 6635- a weekly close below this threshold would be needed to validate a breakout of the broader consolidation pattern. Initial support objectives eyed at the 88.6% retracement / 2023 low at 6270/82 and the 2022 LWC / 2008 low-close at 6200/10 (an area of interest for more significant price inflection IF reached).
Bottom line: AUD/USD has defended support at the lower bounds of a multi-year trendline and puts Aussie right back in the middle of the yearly range. From a trading standpoint, losses should be limited to the weekly open IF price is heading higher on this stretch with a close above 6693 needed to suggest a more significant low was registered this week. As always, watch the weekly close here. Review my latest Australian Dollar Short-term Outlook for a closer look at the near-term AUD/USD technical trade levels.
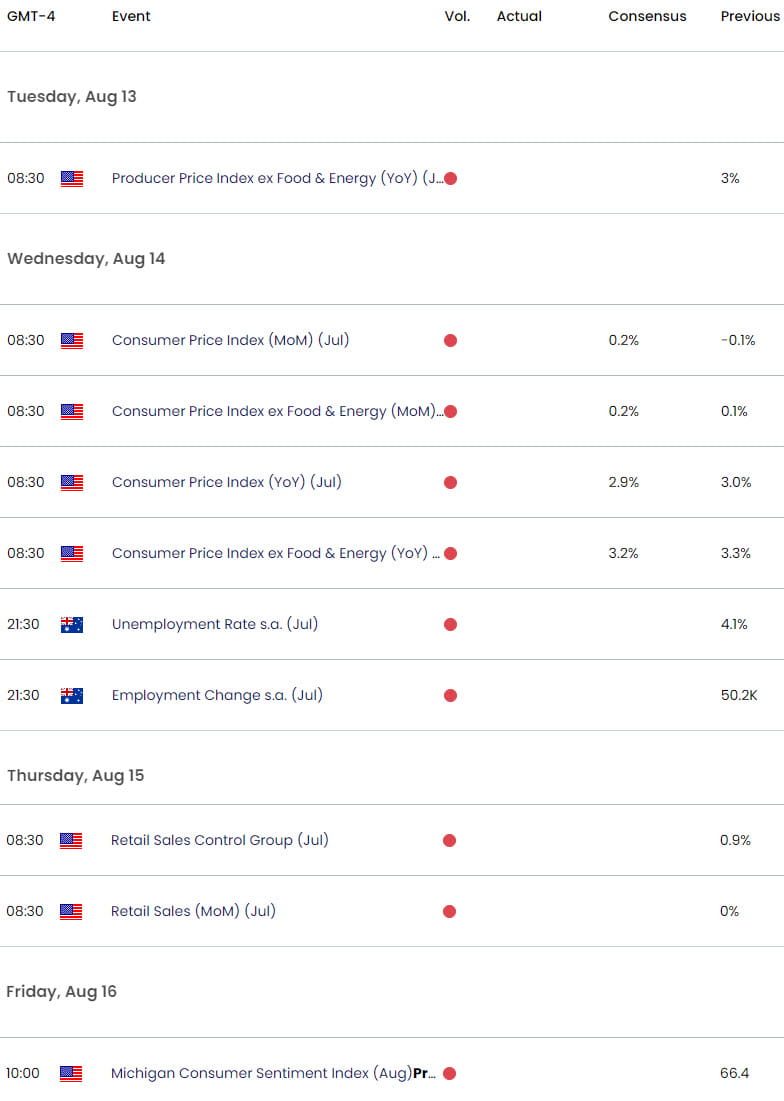
Australia / US Economic Calendar

Economic Calendar - latest economic developments and upcoming event risk.
Active Weekly Technical Charts
- Canadian Dollar (USD/CAD)
- US Dollar Index (DXY)
- Japanese Yen (USD/JPY)
- Euro (EUR/USD)
- British Pound (GBP/USD)
- Crude Oil (WTI)
- Gold (XAU/USD)
--- Written by Michael Boutros, Sr Technical Strategist with FOREX.com
Follow Michael on X @MBForex


