Australian Dollar Technical Outlook: AUD/USD Short-term Trade Levels
- Australian Dollar surges more than 4.6% after registering fresh yearly low
- AUD/USD recovery now testing technical resistance- weekly opening range breakout imminent
- Resistance 6626/40, 6670/93 (key), 6759/61– Support 6572, 6541, 6497 (key)
The Australian Dollar marked a massive outside weekly-reversal off support last week with AUD/USD rallying 4.64% from fresh yearly lows. The recovery is now approaching the first major resistance hurdle with a tight weekly opening-range intact just below. Battle lines drawn on the AUD/USD short-term technical charts.
Review my latest Weekly Strategy Webinar for an in-depth breakdown of this AUD/USD technical setup and more. Join live on Monday’s at 8:30am EST.
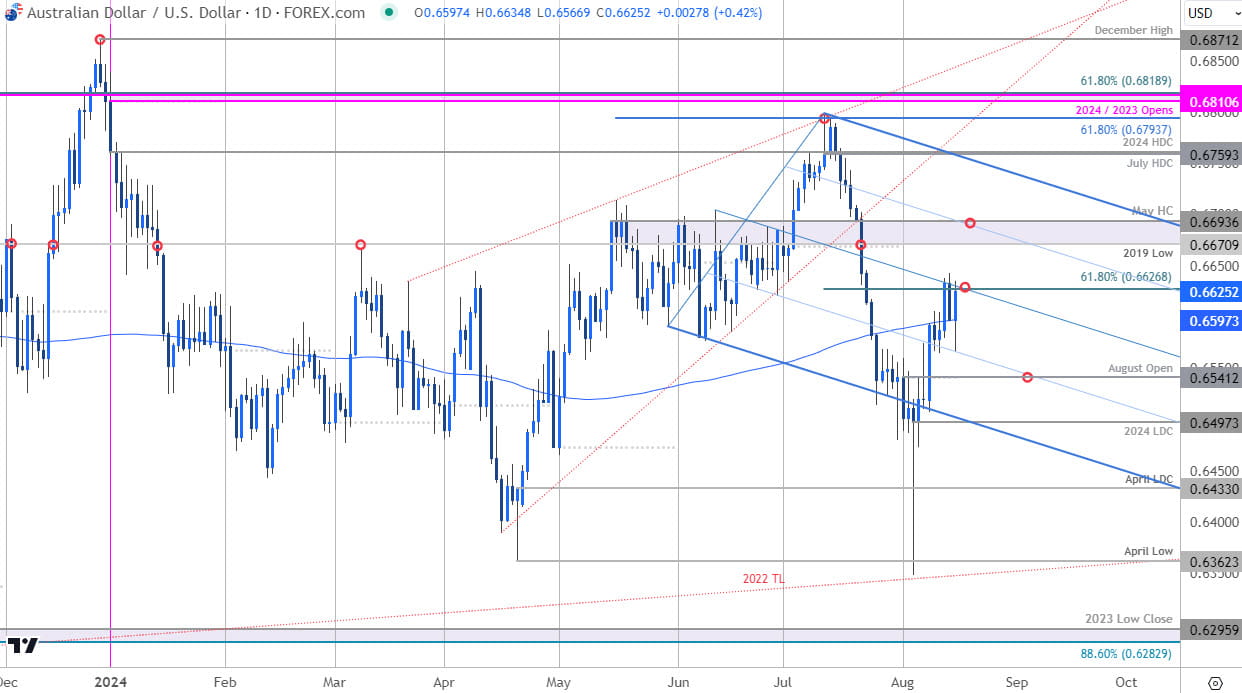
Australian Dollar Price Chart – AUD/USD Daily

Chart Prepared by Michael Boutros, Sr. Technical Strategist; AUD/USD on TradingView
Technical Outlook: In my last Australian Dollar Short-term Outlook we noted that AUD/USD had, “defended the yearly lows with the weekly range set just below the objective August-open- looking for a reaction there IF reached. From a trading standpoint, pullbacks should be limited to the low-day close IF price is heading for a near-term breakout with a close above 6627 needed to validate yesterday’s low.”
A breach / daily close above the monthly open two-days later fueled a rally of more than 1.5% with Aussie now testing resistance around the 61.8% Fibonacci retracement of the July decline at 6627. It has not been the cleanest touch so far and the immediate focus is on the median-line (blue) of this proposed descending pitchfork formation- a close above this slope would be needed to fuel the next leg in price with the Aussie bulls vulnerable while below.
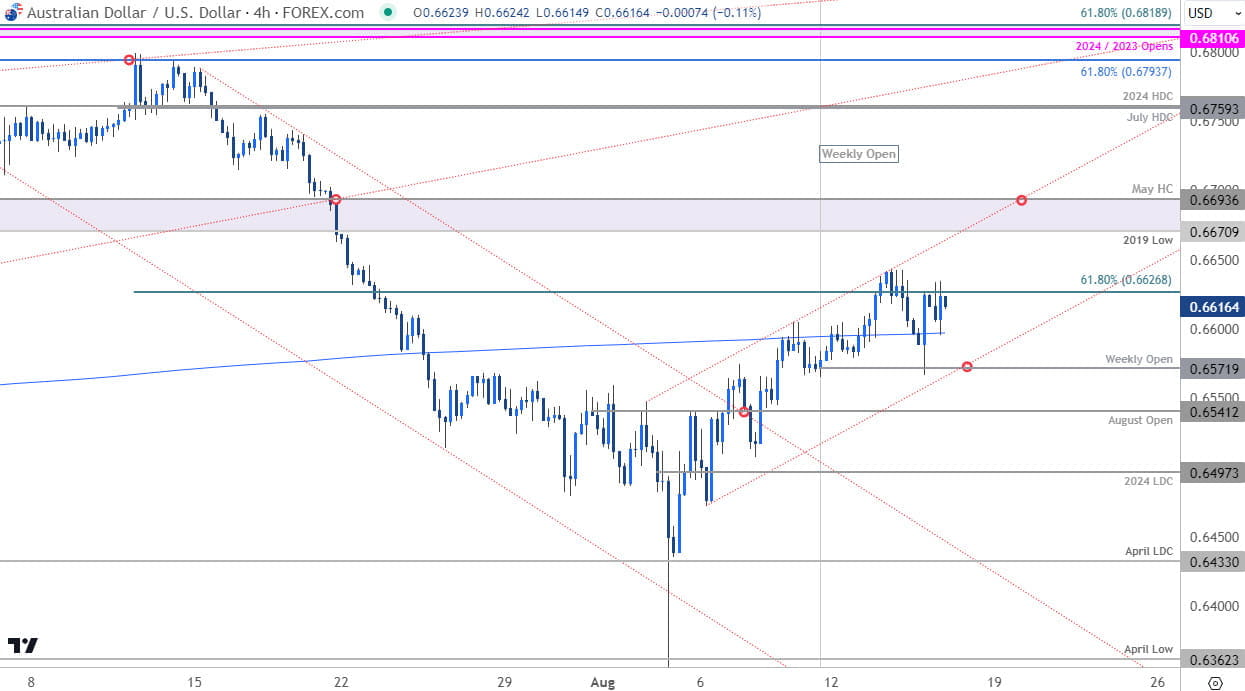
Australian Dollar Price Chart – AUD/USD 240min

Chart Prepared by Michael Boutros, Sr. Technical Strategist; AUD/USD on TradingView
Notes: A closer look at Aussie price action shows AUD/USD trading within the confines of near-term ascending channel formation with the objective weekly opening-range intact heading into Friday. Weekly open support rests at 6571 and is backed by the objective August open at 6541. A break / close below this threshold would threaten the monthly advance and expose the yearly low-day close (LDC) at 6497- an area of interest for possible downside exhaustion IF reached.
A topside breach / close above of the weekly opening-range highs (6640s) is needed to mark uptrend resumption with the next major resistance hurdle eyed at 6670/93- a pivot region defined by the 2019 swing low and the May high-close (HC). Look for a larger reaction there IF reached with a close above needed to suggest a more significant low was registered this month and keep the focus on a stretch towards the July / 2024 high-day closes (HDC) at 6759/61.
Bottom line: A rally off fresh yearly lows is now testing major technical / Fibonacci resistance and while the near-term outlook remains constructive, the immediate advance may be vulnerable here. From a trading standpoint, a good zone to reduce portions of long-exposure / raise protective stops – losses should be limited to the monthly open IF price is heading higher on this stretch with a breakout of the weekly opening-range highs needed to mark resumption. Watch the weekly close here - review my latest Australian Dollar Weekly Forecast for a closer look at the longer-term AUD/USD technical trade levels.
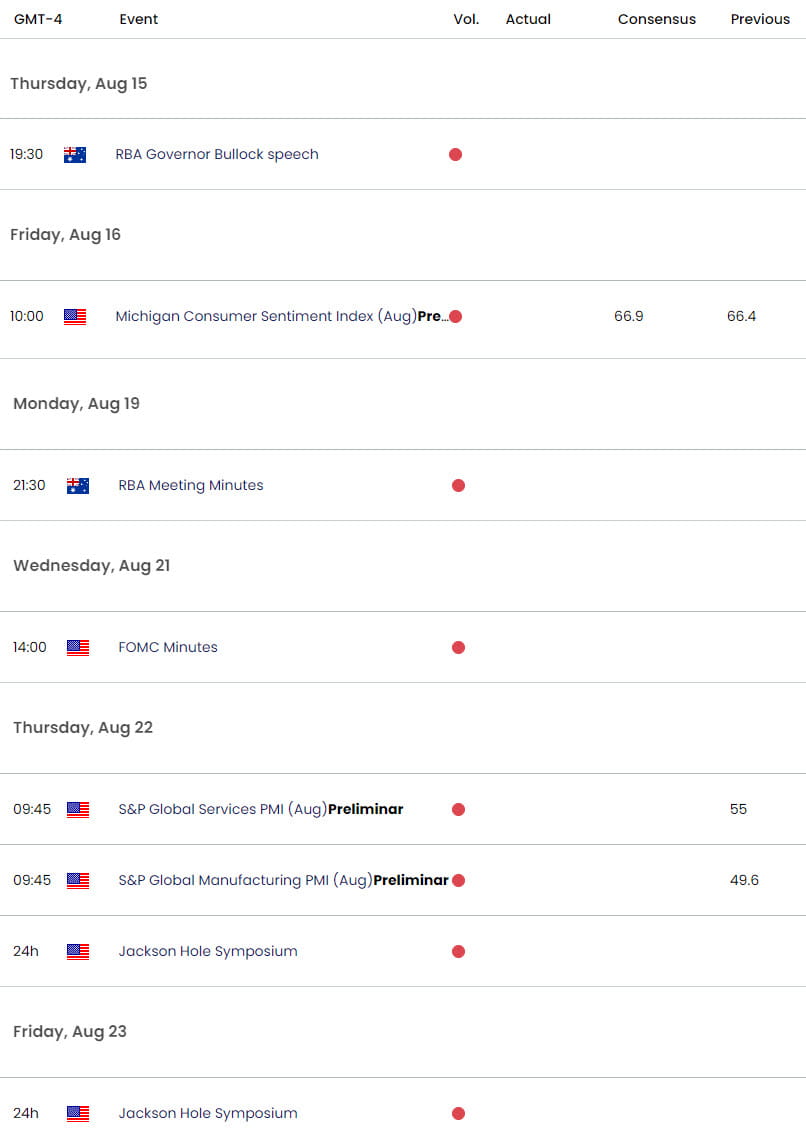
Key AUD/USD Economic Data Releases

Economic Calendar - latest economic developments and upcoming event risk.
Active Short-term Technical Charts
- Euro Short-term Technical Outlook: EUR/USD Breakout Eyes 2024 High
- British Pound Short-term Outlook: GBP/USD Rips to Resistance
- Gold Short-term Technical Outlook: XAU/USD Rally Runs to Resistance
- Canadian Dollar Short-term Outlook: USD/CAD Reversal at Key Support
- US Dollar Short-term Technical Outlook: USD Bulls Emerge
Written by Michael Boutros, Sr Technical Strategist with FOREX.com
Follow Michael on X @MBForex


