AUD/USD Outlook: AUD/USD
AUD/USD snaps the series of higher highs and lows from last week after staging another failed attempt to test the September high (0.6522), and the Reserve Bank of Australia (RBA) interest rate decision may do little to prop up the exchange rate as the central bank is expected to keep the official cash rate (OCR) on hold for the fifth consecutive meeting.
Australian Dollar Forecast: AUD/USD Faces RBA and US NFP Report
The opening range for October is in focus amid the key event risks on tap for this week, and more of the same from the RBA may drag on AUD/USD as the central bank appears reluctant to implement higher interest rates.
Join David Song for the Weekly Fundamental Market Outlook webinar. Register Here
Australia Economic Calendar

The RBA is anticipated to hold the OCR at 4.10% in October as ‘the economy was experiencing a period of subdued growth,’ and Governor Philip Lowe and Co. may stick to the sidelines over the remainder of the year as ‘the recent flow of data was consistent with inflation returning to target within a reasonable timeframe while the cash rate remained at its present level.’
As a result, the Australian Dollar may continue to underperform against its US counterpart as the RBA seems to be at the end of its hiking-cycle, but AUD/USD may attempt to defend the September low (0.6332) should Governor Lowe and Co. show a greater willingness to further combat inflation.
US Economic Calendar

In turn, AUD/USD may consolidate ahead of the US Non-Farm Payrolls (NFP) report as the economy is projected to add 163K jobs in September, and speculation surrounding the Federal Reserve may influence the near-term outlook for the exchange rate as Chairman Jerome Powell and Co. appear to be on track to keep interest rates higher for longer.
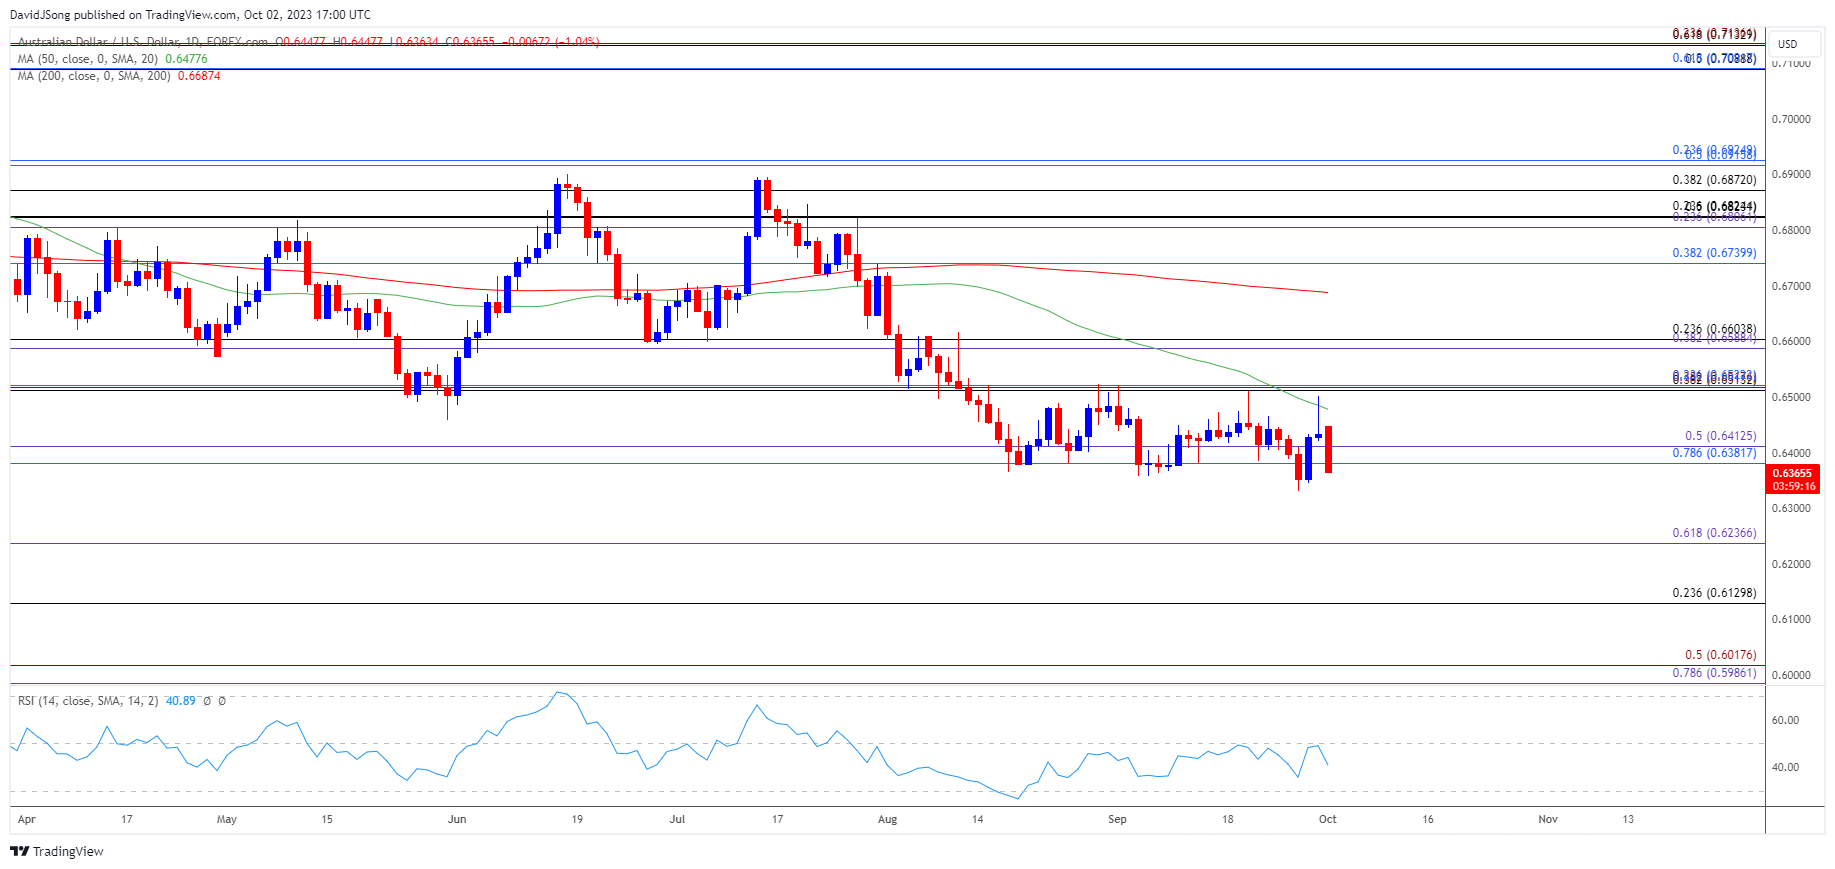
With that said, AUD/USD may struggle to retain the advance from the September low (0.6332) should the RBA keep the OCR on hold, and the exchange rate may track the negative slope in the 50-Day SMA (0.6478) as it struggles to trade back above the moving average.
AUD/USD Price Chart – Daily

Chart Prepared by David Song, Strategist; AUD/USD on TradingView
- AUD/USD snaps the series of higher highs and lows from last week after struggling to trade back above the 50-Day SMA (0.6478), and the exchange rate may track the negative slope in the moving average as the recent rebound unravels ahead of the September high (0.6522).
- A close below the 0.6380 (78.6% Fibonacci retracement) to 0.6410 (50% Fibonacci extension) region brings the yearly low (0.6332) on the radar, with the next area of interest coming in around 0.6240 (61.8% Fibonacci extension).
- Nevertheless, AUD/USD may consolidate if it defends the yearly low (0.6332), with a move above the moving average bringing the 0.6510 (38.2% Fibonacci retracement) to 0.6520 (23.6% Fibonacci retracement) area back on the radar, which largely lines up with the September high (0.6522).
Additional Market Outlooks
US Dollar Forecast: USD/CAD Recovers Ahead of September Low
GBP/USD Forecast: RSI Attempts to Climb Out from Oversold Territory
--- Written by David Song, Strategist
Follow on Twitter at @DavidJSong


