Australian Dollar Outlook: AUD/USD
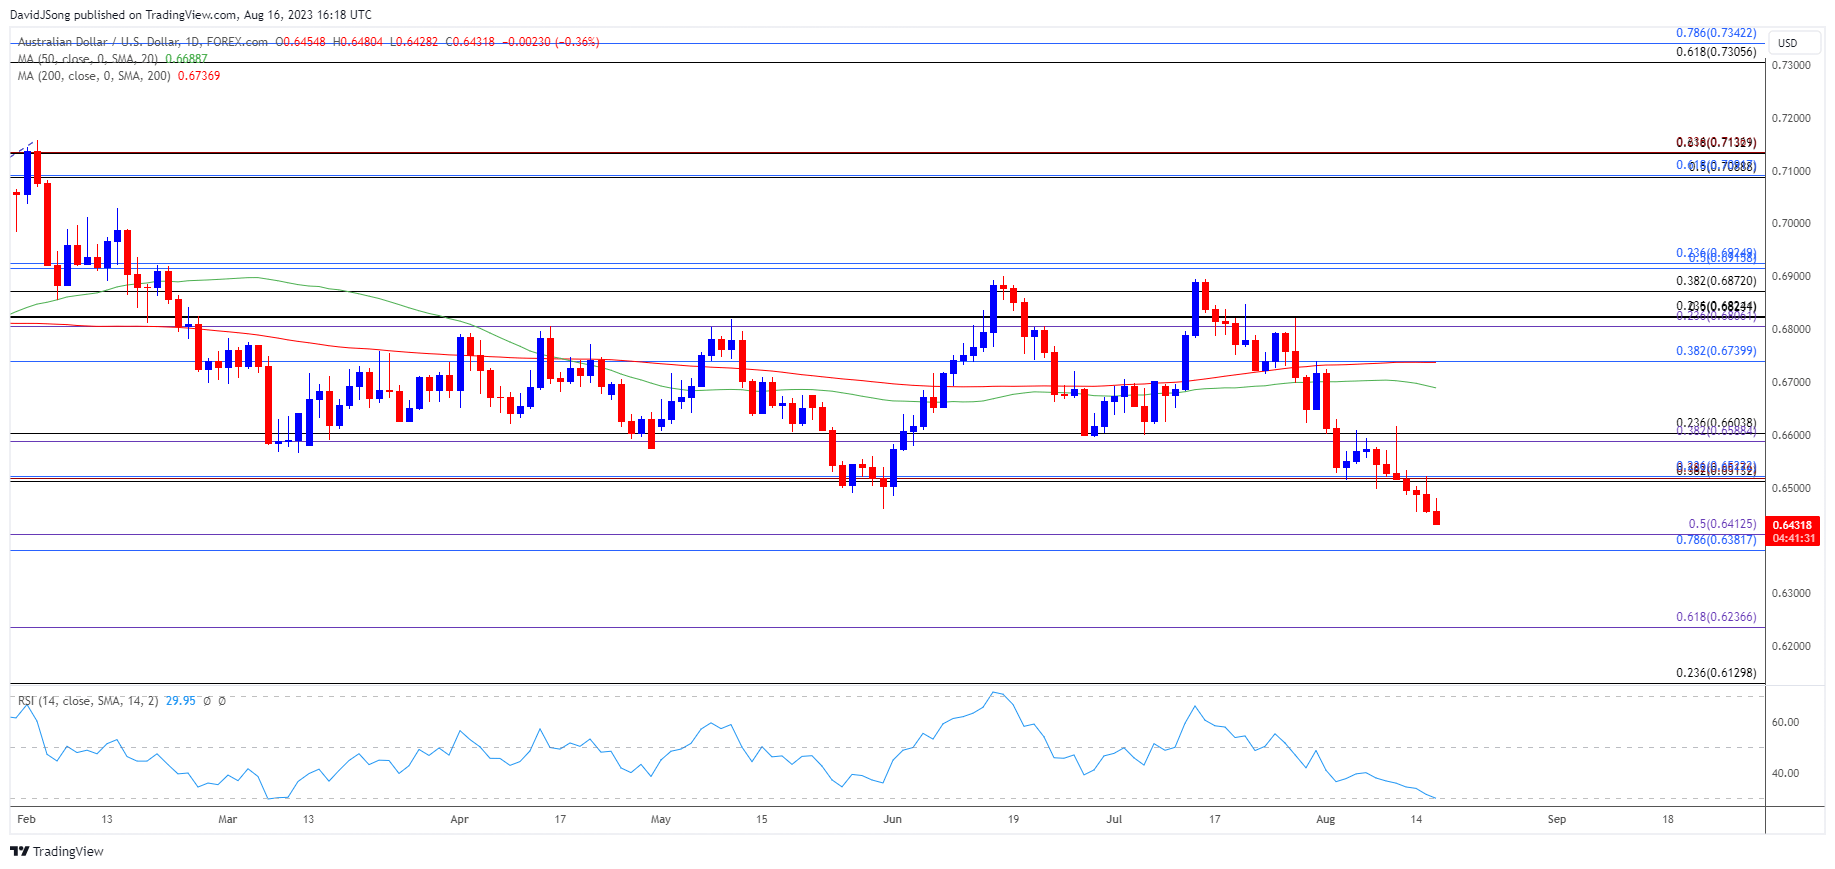
AUD/USD takes out the May low (0.6459) as it weakens for the seven consecutive days, and a further decline in the exchange rate may trigger an oversold reading in the Relative Strength Index (RSI) as the oscillator sits at its lowest level since March.
Australian Dollar Forecast: AUD/USD at Risk of Oversold RSI Signal
AUD/USD seems to be mirroring the weakness in Asia/Pacific currencies as it registers a fresh yearly low (0.6428), and a move below 30 in the RSI is likely to be accompanied by a further decline in the exchange rate like the price action from last year.
Join David Song for the Weekly Fundamental Market Outlook webinar. Register Here
Australia Economic Calendar

As a result, AUD/USD may continue to give back the advance from the November 2022 low (0.6272) if the RSI shows the bearish momentum gathering pace, and it remains to be seen if the update to Australia’s Employment report will influence the exchange rate as the economy is expected to add 15.0K jobs in July.
A positive development may generate a bullish reaction in AUD/USD as it raises the Reserve Bank of Australia’s (RBA) scope to pursue a more restrictive policy, and the central bank may keep the door open to implement higher interest rates as ‘members observed that the labour market had continued to show considerable resilience.’
However, a weaker-than-expected employment report may drag on the Australian Dollar as it encourages the RBA to stay on the sidelines, and it remains to be seen if Governor Philip Lowe and Co. will adjust the forward guidance at the next meeting on September 5 as the minutes from the August meeting points out that ‘expectation from both market pricing and the median of market economists’ forecasts was that a 25 basis point increase would bring rates to their peak for the current tightening phase.’
With that said, Australia’s Employment report may sway AUD/USD as the RBA seems to be nearing the end of its hiking-cycle, but a move below 30 in the Relative Strength Index (RSI) may accompany a further decline in the exchange rate like the price action from last year.
Australian Dollar Price Chart – AUD/USD Daily

Chart Prepared by David Song, Strategist; AUD/USD on TradingView
- AUD/USD initiates a series of lower highs and lows after taking out the May low (0.6459), with a break/close below the 0.6380 (78.6% Fibonacci retracement) to 0.6410 (50% Fibonacci extension) region raising the scope for a move towards the November 2022 low (0.6272).
- At the same time, a move below 30 in the Relative Strength Index (RSI) is likely to be accompanied by a further decline in AUD/USD like the price action from last year, with the next area of interest coming in around 0.6240 (61.8% Fibonacci extension).
- However, failure to break/close below the 0.6380 (78.6% Fibonacci retracement) to 0.6410 (50% Fibonacci extension) region may keep the RSI above 30, with a move above the 0.6310 (38.2% Fibonacci retracement) to 0.6520 (23.6% Fibonacci retracement) area bringing the 0.6590 (38.2% Fibonacci extension) to 0.6600 (23.6% Fibonacci retracement) zone back on the radar.
Additional Market Outlooks
GBP/USD Outlook Mired by Failure to Defend Monthly Opening Range
USD/JPY Breaks Above Monthly Opening Range to Eye Yearly High
--- Written by David Song, Strategist
Follow on Twitter at @DavidJSong


