Australian Technical Forecast: AUD/USD Weekly Trade Levels
- Australian Dollar pares five-day rally- poised to mark third consecutive weekly decline
- AUD/USD marks weekly close below key support- threatens fresh yearly lows
- Resistance 6381/93, 6433, 6500– Support ~6280s, 6200/10, 6007/45
The Australian Dollar is poised for a third consecutive weekly decline with AUD/USD plunging more than 1%. Aussie is now poised to mark the first weekly close below a key pivot zone we’ve been tracking for months now as the rebound from the monthly low unravels. These are the updated targets and invalidation levels that matter on the AUD/USD weekly technical chart.
Review my latest Weekly Strategy Webinar for an in-depth breakdown of this Aussie setup and more. Join live on Monday’s at 8:30am EST.
Australian Dollar Price Chart – AUD/USD Weekly

Chart Prepared by Michael Boutros, Sr. Technical Strategist; AUD/USD on TradingView
Technical Outlook: In last month’s Australian Dollar Technical Forecast we noted that AUD/USD was trading at multi-month support, “at 6381/93- a region defined by the October weekly reversal-close and the 78.6% Fibonacci retracement of the 2022. A break / weekly close below this threshold would be needed to mark resumption of the broader downtrend towards the March slope (~6300) and key support at 6200/10- a region defined by the 100% extension of the yearly decline, the 2022 low-week close and the 2008 low close.”
Aussie registered a high an intraday high at 6501 into the close of September before plunging lower with this week marking the first close below key support. Initial weekly support steady along the March trendline (currently ~6280s) and is backed by 6200/10 – look for a larger reaction in there IF reached.
Initial weekly resistance now 6381/93 backed by the October-open at 6433 and the 6500-pivot zone. Broader bearish invalidation now lowered to the May low-week close / 38.2% Fibonacci retracement of the yearly range at 6607/18- a breach / close above this threshold would ultimately be needed to suggest a more significant low is in place.
Bottom line: Aussie remains vulnerable here with the first weekly close below key support and we’re searching for a low in the weeks ahead. From a trading standpoint, look to reduce short-exposure / lower protective stops on a stretch towards 6200 – rallies should be limited to the monthly open (6433) IF price is heading lower here. Keep in mind that the October opening-range remains intact- look for the breakout to fuel the next leg in price. I’ll publish an updated Australian Dollar Short-term Outlook once we get further clarity on the near-term AUD/USD technical trade levels.
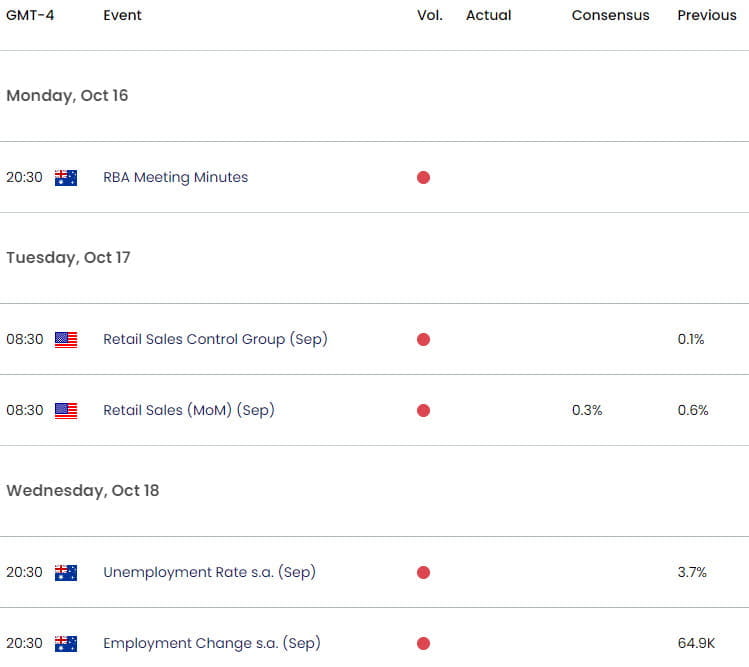
Australia / US Economic Calendar

Economic Calendar - latest economic developments and upcoming event risk.
Active Weekly Technical Charts
- Crude Oil (WTI)
- US Dollar (DXY)
- Gold (XAU/USD)
- Euro (EUR/USD)
- Canadian Dollar (USD/CAD)
- British Pound (GBP/USD)
- Japanese Yen (USD/JPY)
--- Written by Michael Boutros, Sr Technical Strategist with FOREX.com
Follow Michael on Twitter @MBForex


