Australian Dollar Outlook: AUD/USD
AUD/USD carves a series of lower highs and lows after failing to defend the September low (0.6622), and the update to Australia’s Consumer Price Index (CPI) may do little to prop up the exchange rate as the report is anticipated to show slowing inflation.
AUD/USD Vulnerable amid Failure to Defend September Low
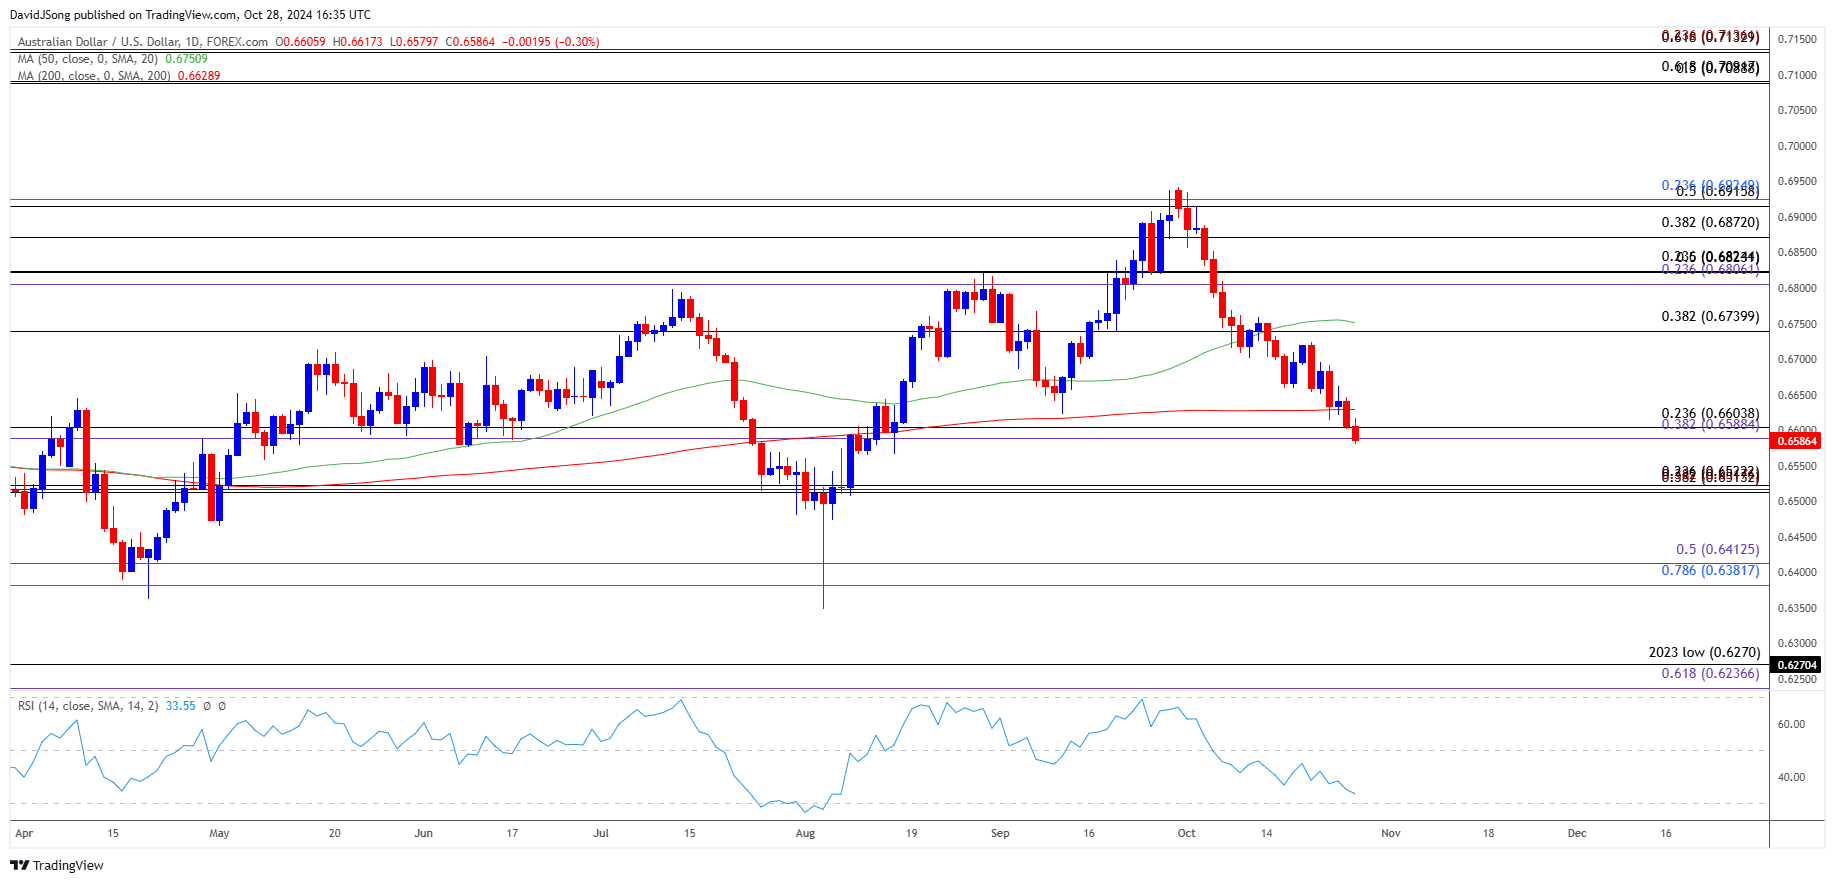
AUD/USD has fallen for four consecutive weeks to mark the longest stretch of decline since January, and the weakness in the exchange rate may persist over the remainder of the month as the Relative Strength Index (RSI) slips to its lowest level since August.
Join David Song for the Weekly Fundamental Market Outlook webinar. David provides a market overview and takes questions in real-time. Register HereAustralia Economic Calendar

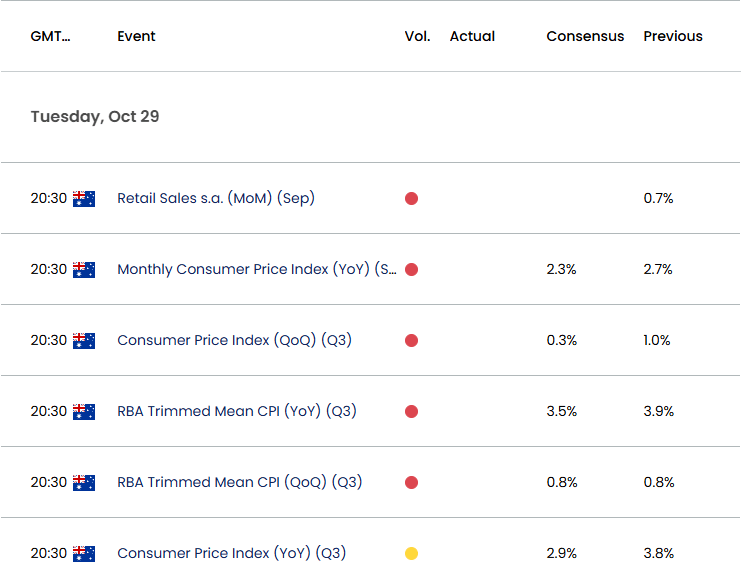
Looking ahead, the monthly update for Australia’s CPI is expected to reveal the headline reading for inflation narrowing to 2.3% in September from 2.7% per annum the month prior, and a material slowdown in consumer prices may drag on the Australian Dollar as it puts pressure on the Reserve Bank of Australia (RBA) to unwind its restrictive policy.
At the same time, a higher-than-expected CPI print may keep the RBA on the sidelines as the central warns that ‘it will be some time yet before inflation is sustainably in the target range,’ and Governor Michele Bullock and Co. may keep the official cash rate (OCR) on hold throughout the remainder of the year as ‘policy will need to be sufficiently restrictive until the Board is confident that inflation is moving sustainably towards the target range.’
With that said, AUD/USD may search for support ahead the next RBA meeting on November 5 as the central bank remains reluctant to switch gears, but the exchange rate may continue to give back the rebound from the August low (0.6349) should the bearish price series persist.
AUD/USD Price Chart – Daily

Chart Prepared by David Song, Strategist; AUD/USD on TradingView
- AUD/USD extends the weakness from the start of October to register a fresh monthly low (0.6580), with a close below the 0.6590 (38.2% Fibonacci extension) to 0.6600 (23.6% Fibonacci retracement) zone opening up the 0.6510 (38.2% Fibonacci retracement) to 0.6520 (23.6% Fibonacci retracement) region.
- Next area of interest comes in around 0.6380 (78.6% Fibonacci retracement) to 0.6410 (50% Fibonacci extension) but the Relative Strength Index (RSI) may show the bearish momentum abating should it continue to hold above oversold territory.
- Failure to close below the 0.6590 (38.2% Fibonacci extension) to 0.6600 (23.6% Fibonacci retracement) zone may curb the bearish price series, with a move back above 0.6740 (38.2% Fibonacci retracement) bringing the 0.6810 (23.6% Fibonacci extension) to 0.6820 (23.6% Fibonacci retracement) region on the radar.
Additional Market Outlooks
Monetary vs Fiscal Policy: Implications for FX Markets
Gold Price Forecast: RSI Falls Back from Overbought Zone
Euro Forecast: EUR/USD Recovery Pulls RSI Out of Oversold Zone
USD/CAD Defends Post-BoC Reaction to Eye August High
--- Written by David Song, Senior Strategist
Follow on X at @DavidJSong


