Australia Dollar Outlook: AUD/USD
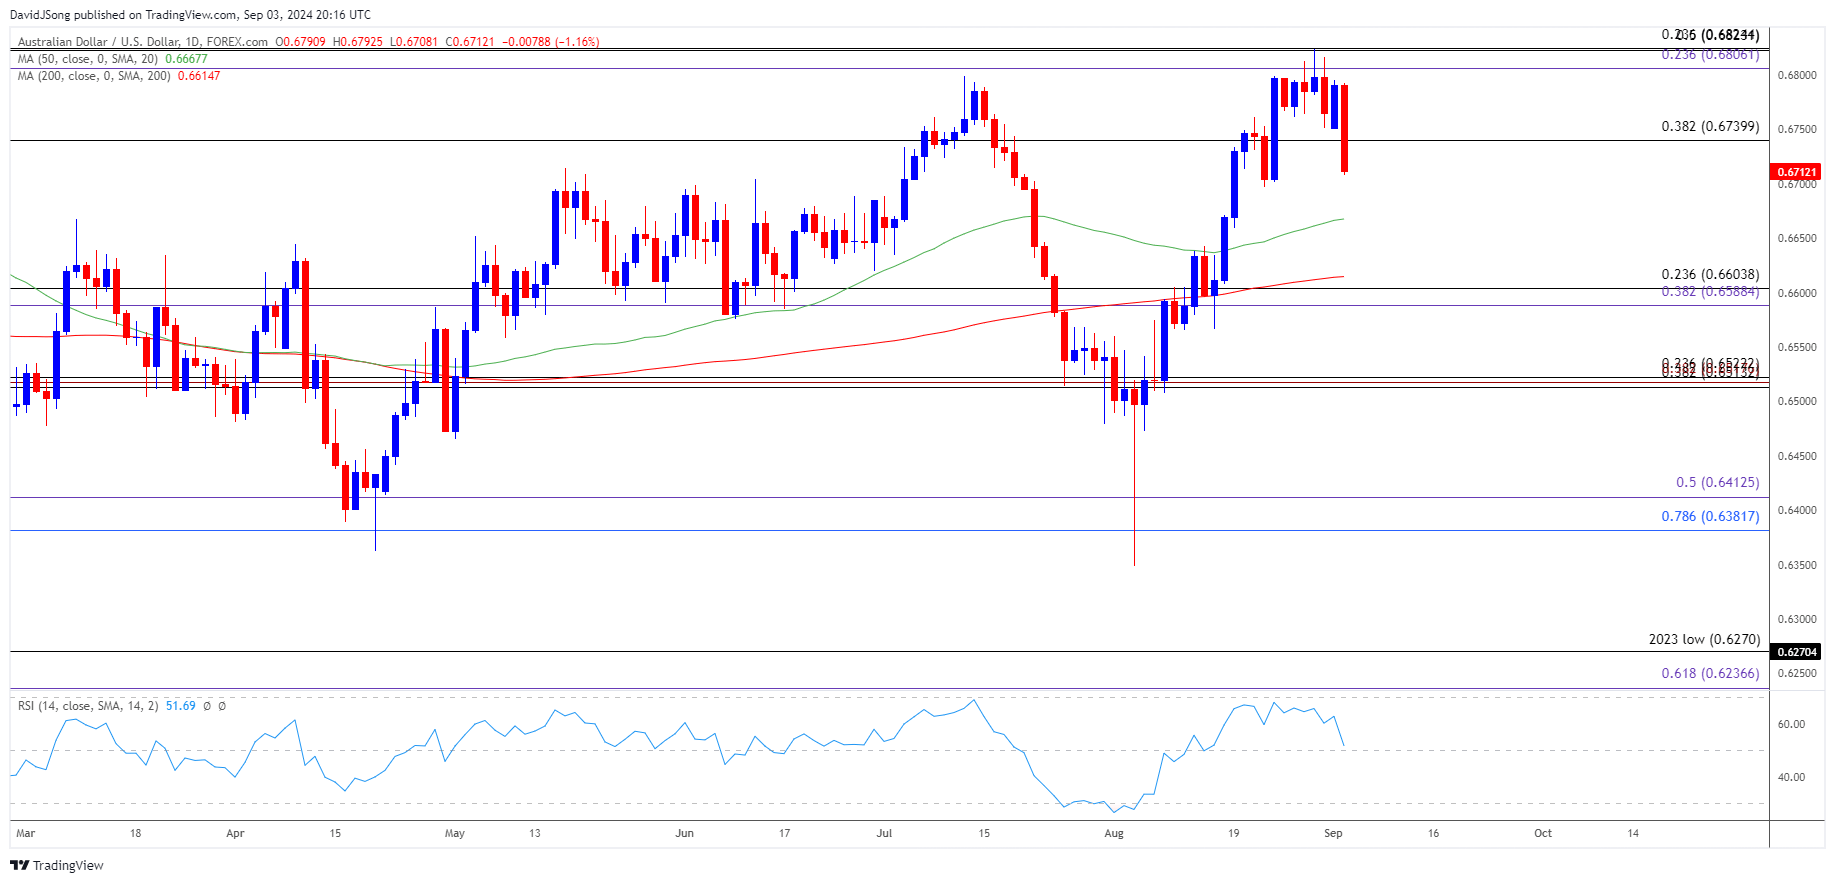
AUD/USD trades to fresh weekly low (0.6708) ahead of Australia’s 2Q Gross Domestic Product (GDP) report, and the Relative Strength Index (RSI) may continue to show the bullish momentum abating as it reverses ahead of 70.
AUD/USD Under Pressure Ahead of Australia GDP Report
Keep in mind, the failed attempts to test the January high (0.6839) kept the RSI out of overbought territory, and the exchange rate may struggle to retain the advance from the August low (0.6349) as it carves a series of lower highs and lows.
Join David Song for the Weekly Fundamental Market Outlook webinar. David provides a market overview and takes questions in real-time. Register Here
Australia Economic Calendar

Nevertheless, the update to Australia’s 2Q GDP report may influence foreign exchange markets as the economy is expected to grow 0.3% after expanding 0.1% expansion during the first three-months of 2024.
A positive development may encourage the Reserve Bank of Australia (RBA) to keep the cash rate at 4.35% as ‘returning inflation to target within a reasonable timeframe remains the Board’s highest priority,’ and a pickup in the growth rate may lead to a bullish reaction in Australian Dollar as it raises the central bank’s scope to further combat inflation.
At the same time, a weaker-than-expected GDP report may put pressure on the RBA to unwind its restrictive policy, and signs of a slowing economy may drag on AUD/USD as it fuels speculation for lower interest rates.
AUD/USD Price Chart – Daily

Chart Prepared by David Song, Strategist; AUD/USD on TradingView
- The opening range for September is in focus for AUD/USD amid the failed attempt to break/close above the 0.6810 (23.5% Fibonacci extension) to 0.6820 (23.6% Fibonacci retracement) zone.
- Failure to hold above 0.6740 (38.2% Fibonacci retracement) may push AUD/USD back towards the 0.6590 (38.2% Fibonacci extension) to 0.6600 (23.6% Fibonacci retracement) area as it carves a series of lower highs and lows, with the next region of interest coming in around 0.6510 (38.2% Fibonacci retracement) to 0.6520 (23.6% Fibonacci retracement).
- However, the bearish price action in AUD/USD may unravel should it retrace the decline from the monthly high (0.6795), with a break/close above the 0.6810 (23.5% Fibonacci extension) to 0.6820 (23.6% Fibonacci retracement) zone opening up the January high (0.6839).
Additional Market Outlooks
Bank of Canada (BoC) Rate Decision Preview (SEP 2024)
Canadian Dollar Forecast: USD/CAD Rebound Emerges Ahead of March Low
US Dollar Forecast: USD/JPY Rally Persists After Defending Weekly Low
GBP/USD Pullback Brings RSI Back from Overbought Zone
--- Written by David Song, Strategist
Follow on Twitter at @DavidJSong


