AUD/USD Outlook
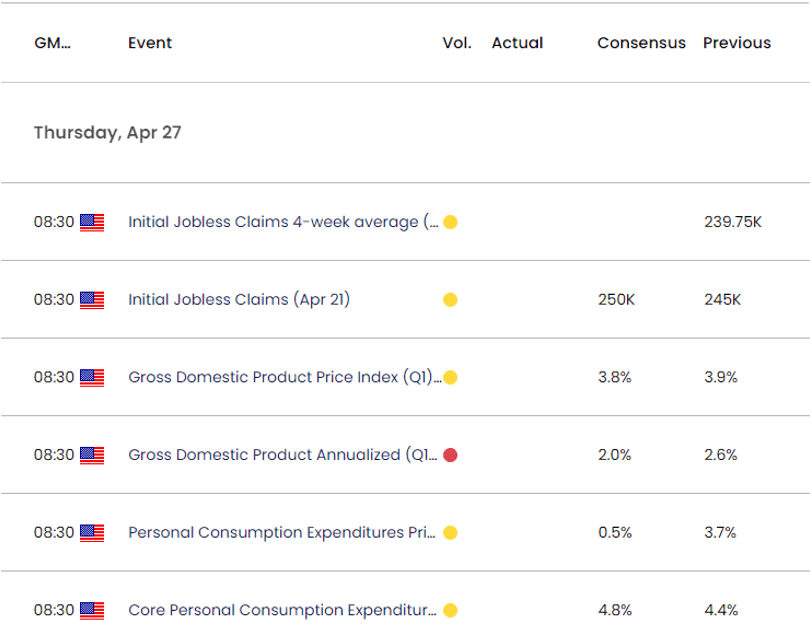
AUD/USD initiates a series of lower highs and lows following the downtick in Australia’s Consumer Price Index (CPI), and the US Gross Domestic Product (GDP) report may keep the exchange rate under pressure as the update is expected to show persistent inflation.
AUD/USD tumbles toward March low following ‘Death Cross’ formation
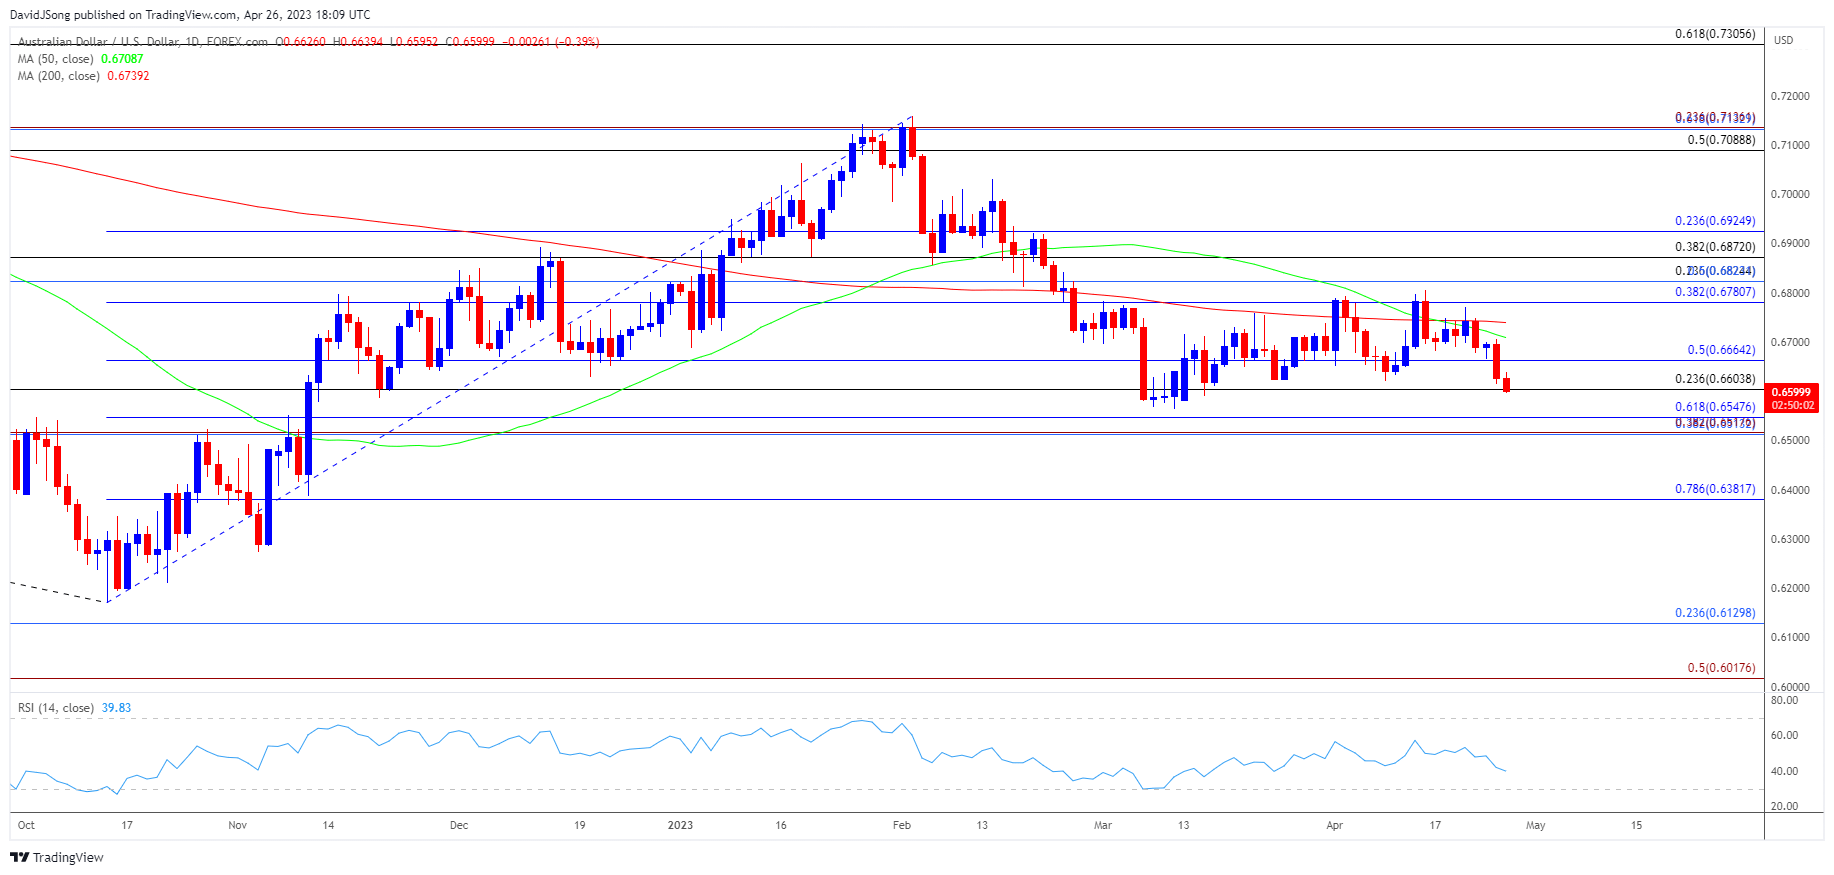
AUD/USD snaps the range bound price action from last week after failing to hold above the 200-Day SMA (0.6739), with the technical outlook raising the scope for a further decline in the exchange rate as the 50-Day SMA (0.6709) now sits below the long-term moving average following the ‘death cross’ formation from earlier this month.
Register here for the next Live Economic Coverage event with David Song

At the same time, data prints coming out of the US may drag on AUD/USD even though the growth rate is expected to slow in the first quarter of 2023 as the core Personal Consumption Expenditure (PCE), the Federal Reserve’s preferred gauge for inflation, is projected to increase to 4.8% from 4.4% per annum during the same period.
In turn, the Federal Reserve may take further steps to combat inflation amid little signs of a looming recession, and AUD/USD may struggle to retain the rebound from the yearly low (0.6565) as the Reserve Bank of Australia (RBA) carries out a wait-and-see approach for monetary policy.

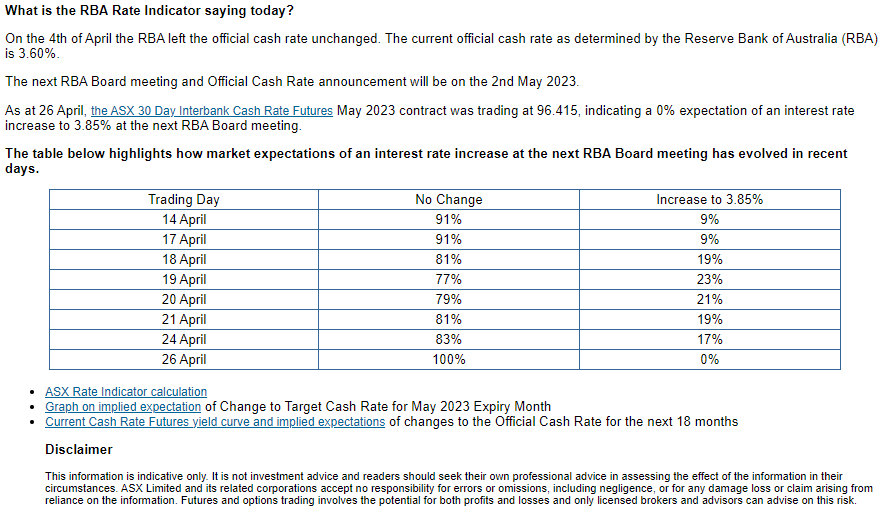
Source: ASX
According to the ASX RBA Rate Indicator, the ‘May 2023 contract was trading at 96.415, indicating a 0% expectation of an interest rate increase to 3.85% at the next RBA Board meeting’ as of April 26, and it remains to be seen if Governor Philip Lowe and Co will adjust the forward guidance at the next rate decision on May 2 as ‘members observed that it was important to be clear that monetary policy may need to be tightened at subsequent meetings.’
Until then, developments coming out of the US may sway AUD/USD amid speculation for another 25bp Fed rate hike in May, and the update to the GDP report may produce headwinds for the exchange rate amid the diverging paths between the RBA and Federal Open Market Committee (FOMC).
With that said, AUD/USD may track the negative slope in both the 50-Day SMA (0.6709) and 200-Day SMA (0.6739) as a ‘death cross’ formation takes shape, and the exchange rate may struggle to retain the rebound from the yearly low (0.6565) as it initiates a fresh series of lower highs and lows.
Australian Dollar Price Chart – AUD/USD Daily

Chart Prepared by David Song, Strategist; AUD/USD on TradingView
- AUD/USD fails to retain the range bound price action from last week after struggling to hold above the 200-Day SMA (0.6739), with a ‘death cross’ formation taking shape as the 50-Day SMA (0.6709) crossed below the long-term moving average.
- AUD/USD may track the negative slope in the moving averages as it slips to a fresh monthly low (0.6595), with a close below the 0.6600 (23.6% Fibonacci retracement) handle raising the scope for a move towards the March low (0.6565).
- Next area of interest coming in around 0.6510 (38.2% Fibonacci retracement) to 0.6550 (61.8% Fibonacci retracement), but failure to close below the 0.6600 (23.6% Fibonacci retracement) handle may curb the recent decline in AUD/USD, with a move above 0.6660 (50% Fibonacci retracement) bringing the 50-Day SMA (0.6709) back on the radar.
Additional Resources
EUR/USD forecast: April 2022 high back on radar
Gold price defends weekly low going into Fed blackout period
--- Written by David Song, Strategist


