Australian Dollar Outlook: AUD/USD
AUD/USD trades to a fresh monthly high (0.6591) as it extends the series of higher highs and lows from earlier this week, and the exchange rate may attempt to test the August high (0.6724) as it climbs above the 200-Day SMA (0.6585) for the first time since July.
AUD/USD Rate Climbs Above 200-Day SMA for First Time Since July
AUD/USD appreciates for the second consecutive week after clearing the opening range for November, and the bullish price action may persist over the remainder of the month should the exchange rate no longer respond to the negative slope in the long-term moving average.
Join David Song for the Weekly Fundamental Market Outlook webinar. Register Here
Australia Economic Calendar

However, data prints coming out of Australia may drag on AUD/USD as Retail Sales are projected to increase 0.1% in October following the 0.9% expansion the month prior, and signs of a slowing economy may push the Reserve Bank of Australia (RBA) to the sidelines following the 25bp rate-hike from earlier this month.
At the same time, a better-than-expected Retail Sales report may generate a bullish reaction in the Australian Dollar as it puts pressure on the RBA to further combat inflation, and it remains to be seen if the upcoming speech by Governor Michele Bullock will provide hints for the December 5 meeting as ‘returning inflation to target within a reasonable timeframe remains the Board’s priority.’
With that said, speculation surrounding the RBA may sway AUD/USD as the central bank keeps the door open to implement higher interest rates, but the exchange rate may continue to retrace the decline from the August high (0.6724) as it climbs above the 200-Day SMA (0.6585) for the first time since July.
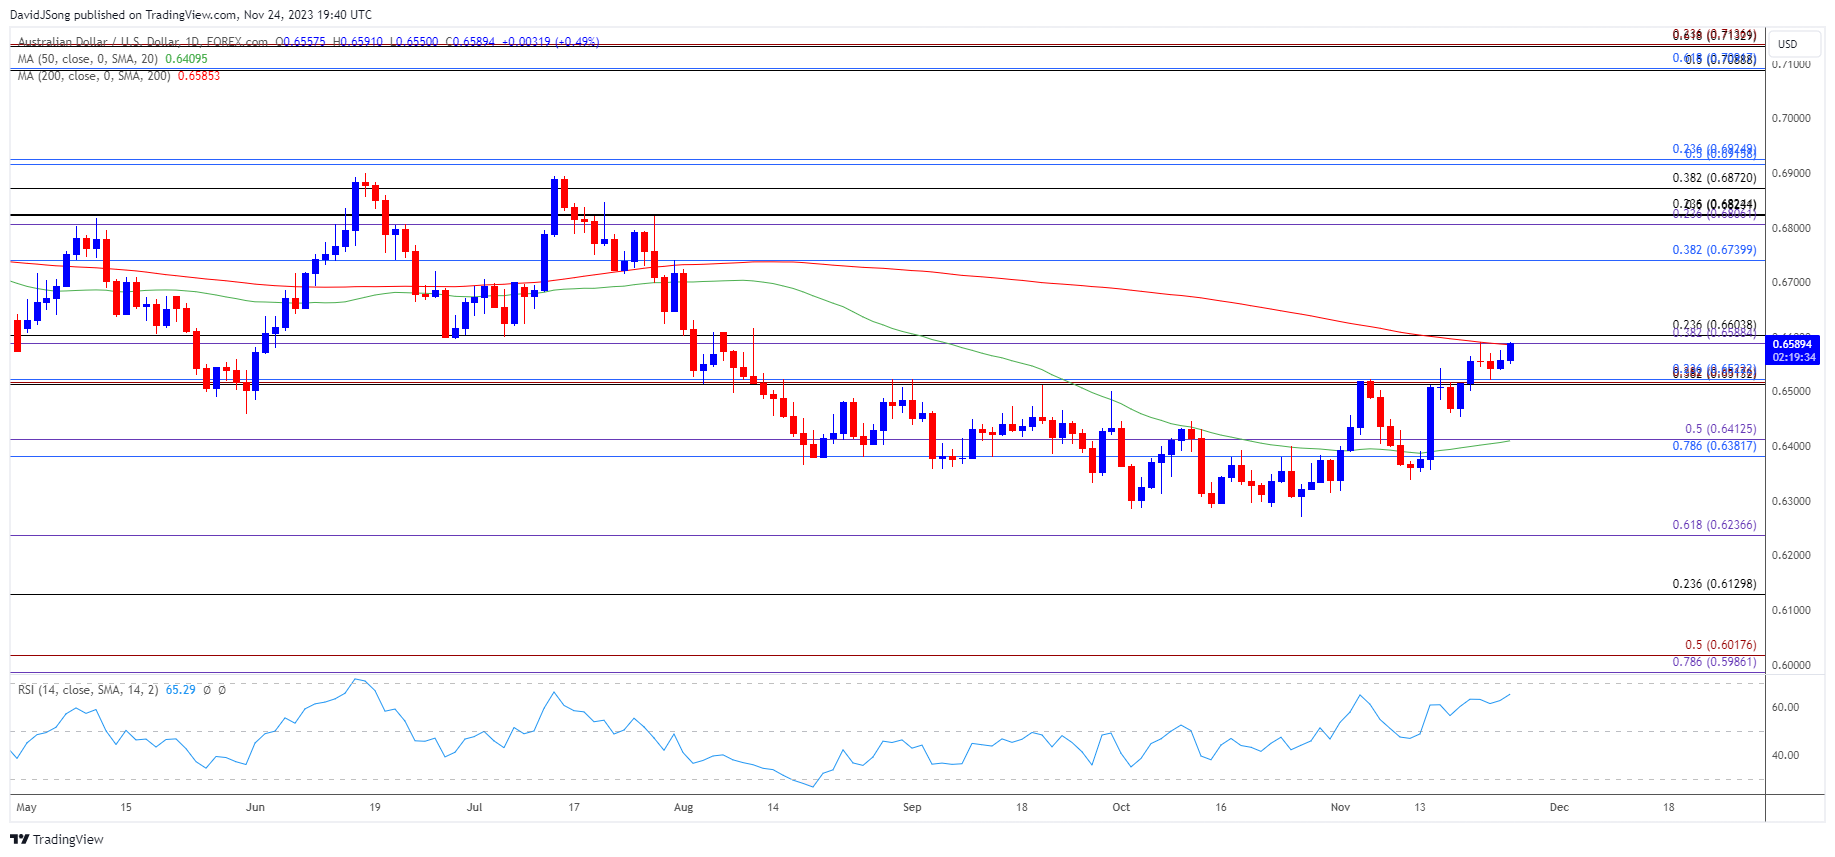
AUD/USD Price Chart – Daily

Chart Prepared by David Song, Strategist; AUD/USD on TradingView
- AUD/USD carves a series of higher highs and lows to register a fresh monthly high (0.6591), and the exchange rate may no longer respond to the negative slope in the 200-Day SMA (0.6585) as it trades above the long-term moving average for the first time since July.
- A break/close above the 0.6590 (38.2% Fibonacci extension) to 0.6600 (23.6% Fibonacci retracement) region raises the scope for a test of the August high (0.6724), with the next area of interest coming in around 0.6740 (38.2% Fibonacci retracement).
- However, failure to break/close above the 0.6590 (38.2% Fibonacci extension) to 0.6600 (23.6% Fibonacci retracement) region may curb the bullish price action in AUD/USD, with a move below the 0.6510 (38.2% Fibonacci retracement) to 0.6520 (23.6% Fibonacci retracement) area opening up the 0.6380 (78.6% Fibonacci retracement) to 0.6410 (50% Fibonacci extension) zone.
Additional Market Outlooks
British Pound Forecast: GBP/USD Pulls Back from Channel Resistance
USD/CAD Forecast: Another Test of Positive Slope in 50-Day SMA
--- Written by David Song, Strategist
Follow on Twitter at @DavidJSong


