AUD/USD Outlook: AUD/USD
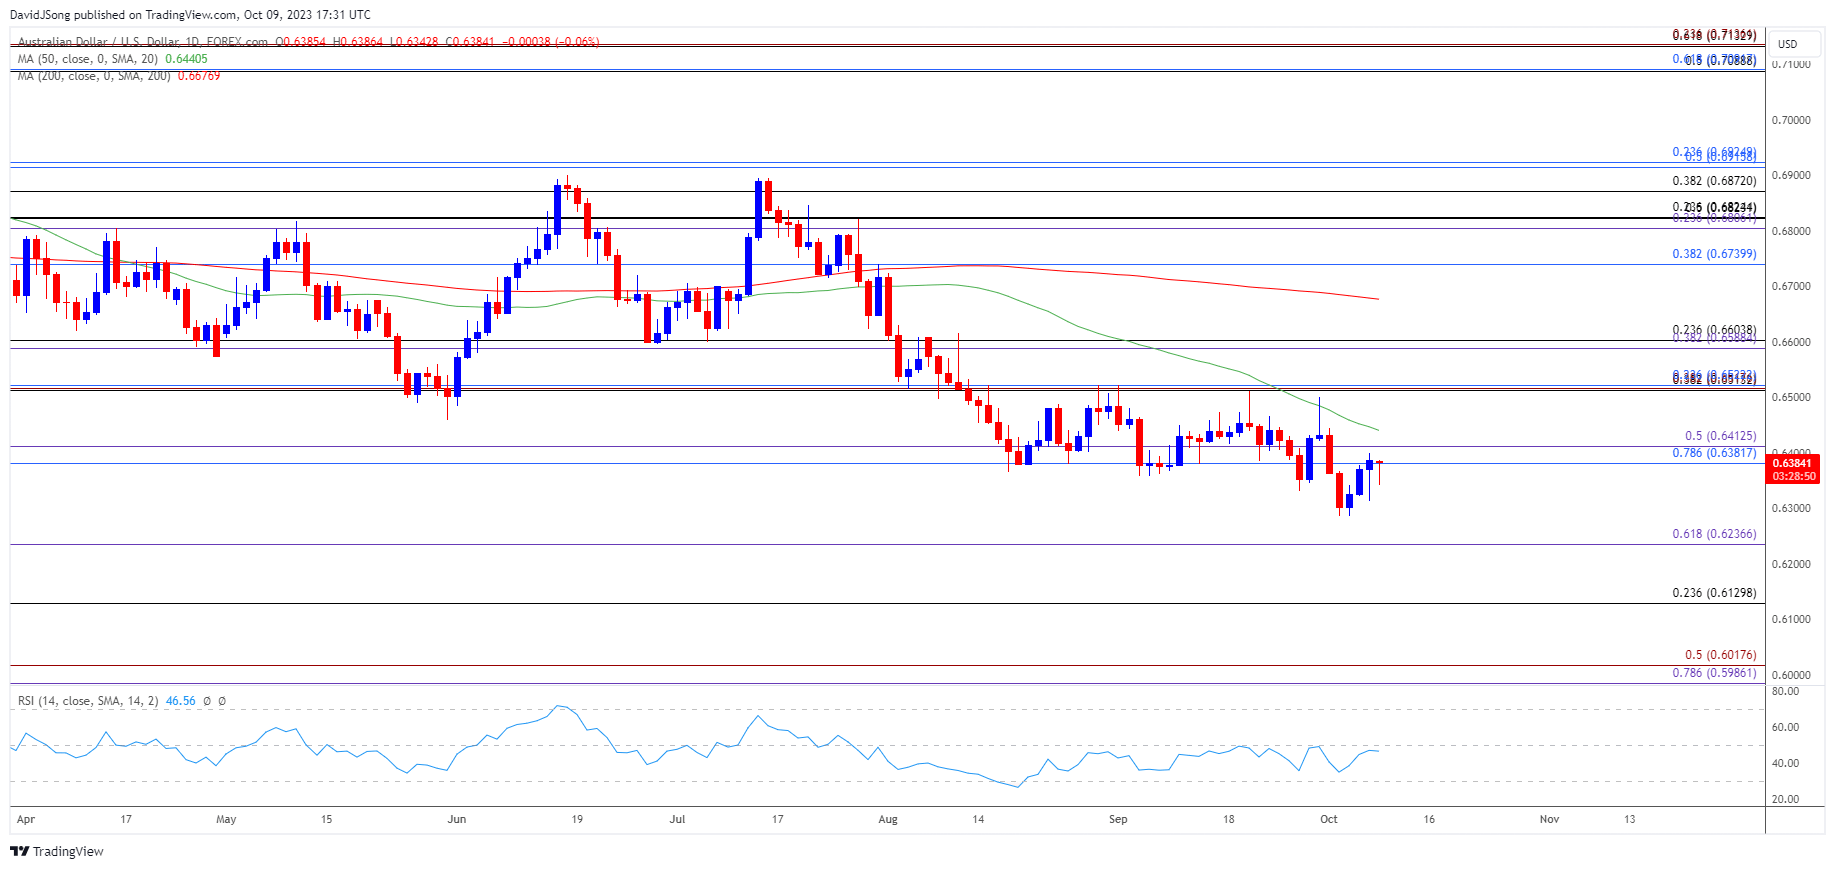
AUD/USD trades in a narrow range after registering a fresh yearly low (0.6286) during the first of October, but the exchange rate may track the negative slope in the 50-Day SMA (0.6440) if it fails to clear the monthly high (0.6445).
AUD/USD Outlook Hinges on Reaction to Negative Slope in 50-Day SMA
AUD/USD struggled to hold its ground as the Reserve Bank of Australia (RBA) kept the official cash rate (OCR) at 4.10%, and the exchange rate may threaten the opening range for October as the central bank warns that ‘the economy is still experiencing a period of below-trend growth.’
Join David Song for the Weekly Fundamental Market Outlook webinar. Register Here
It seems as though the RBA is reluctant to implement higher interest rates as Governor Michele Bullock and Co. reiterate that the ‘recent data are consistent with inflation returning to the 2–3 per cent target range over the forecast period,’ and the Australian Dollar may continue to underperform against its US counterpart as the Federal Reserve keeps the door open to pursue a more restrictive policy.
US Economic Calendar

However, the update to the US Consumer Price Index (CPI) may produce headwinds for the Greenback as both the headline and core rate are anticipated to show slowing inflation, and AUD/USD may attempt to retrace the decline from the monthly high (0.6445) should the data prints fuel speculation of seeing US interest rates unchanged over the remainder of the year.
At the same time, a stronger-than-expected CPI report may generate a bullish reaction in the US Dollar as it puts pressure on the Federal Open Market Committee (FOMC) to further combat inflation, and AUD/USD may track the negative slope in the 50-Day SMA (0.6440) as it appears to be reversing ahead of the monthly high (0.6445).
With that said, a downtick in the US CPI may prop up AUD/USD as it encourages the Fed to keep interest rates on hold, but the exchange rate may stage further attempts to test the November 2022 low (0.6272) if it fails to defend the opening range for October.
AUD/USD Price Chart – Daily

Chart Prepared by David Song, Strategist; AUD/USD on TradingView
- AUD/USD may attempt to extend the rebound from a fresh yearly low (0.6286) as it holds above the November 2022 low (0.6272), with a break/close above the 0.6380 (78.6% Fibonacci retracement) to 0.6410 (50% Fibonacci extension) region raising the scope for a run at the monthly high (0.6445).
- Next area of interest comes in around 0.6510 (38.2% Fibonacci retracement) to 0.6520 (23.6% Fibonacci retracement) area back on the radar, which largely lines up with the September high (0.6522), but AUD/USD may track the negative slope in the 50-Day SMA (0.6440) if it fails to clear the monthly high (0.6445).
- A breach below the monthly low (0.6286) brings the November 2022 low (0.6272) back on the radar, with a break/close below 0.6240 (61.8% Fibonacci extension) opening up the 2022 low (0.6170).
Additional Market Outlooks
US Dollar Forecast: EUR/USD Rebound Emerges Ahead of December 2022 Low
US Dollar Forecast: USD/CAD RSI Flirts with Overbought Zone
--- Written by David Song, Strategist
Follow on Twitter at @DavidJSong


