Australian Dollar Outlook: AUD/USD
AUD/USD registers a fresh yearly low (0.6358) as the Reserve Bank of Australia (RBA) keeps the official cash rate (OCR) at 4.10% in September, and another move below 30 in the Relative Strength Index (RSI) is likely to be accompanied by a further decline in the exchange rate like the price action from last month.
AUD/USD Forecast: RSI Susceptible to Another Oversold Reading
AUD/USD may struggle to retain the advance from the November 2022 low (0.6272) as the RBA insists that ‘the recent data are consistent with inflation returning to the 2–3 per cent target range over the forecast horizon,’ and it seems as though the central bank will retain a wait-and-see approach as ‘there are significant uncertainties around the outlook.’
Join David Song for the Weekly Fundamental Market Outlook webinar. Register Here
Australia Economic Calendar

As a result, the update to Australia’s Gross Domestic Product (GDP) report may do little to sway the RBA as the economy is expected to grow 0.3% in the second quarter after expanding 0.2% during the previous period, and speculation surrounding US monetary policy may influence AUD/USD as the Federal Reserve keeps the door open to implement higher interest rates.
Atlanta Fed GDPNow Forecasting Model

Source: Atlanta Fed
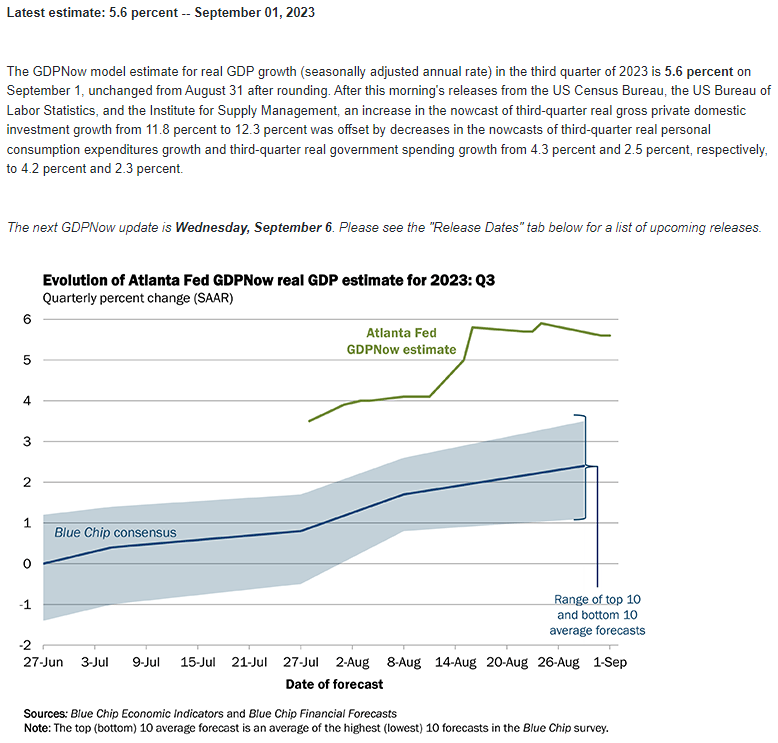
According to the Atlanta Fed GDPNow model, the ‘estimate for real GDP growth (seasonally adjusted annual rate) in the third quarter of 2023 is 5.6 percent on September 1,’ and signs of a robust economy may push the Federal Open Market Committee (FOMC) to pursue a more restrictive policy as the Personal Consumption Expenditure (PCE) Price Index, the Fed’s preferred gauge for inflation, points to persistent price growth.
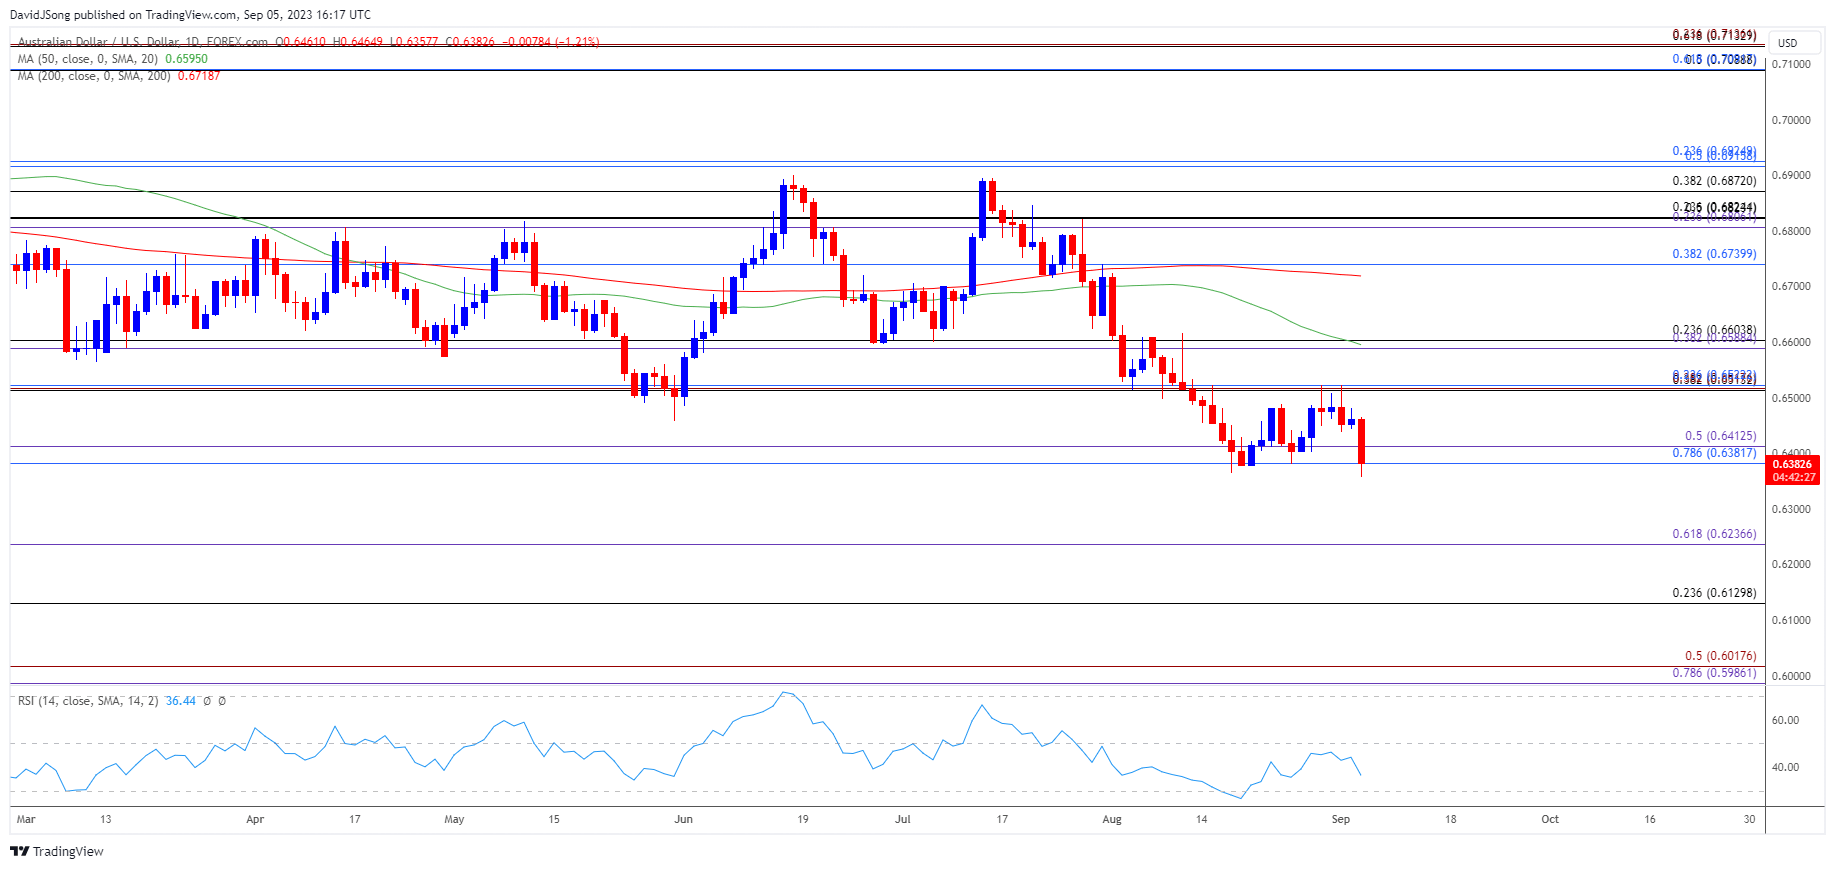
With that said, the diverging paths between the RBA and FOMC may keep AUD/USD under pressure as it extends the decline from the start of the month, and a move below 30 in the Relative Strength Index (RSI) is likely to be accompanied by a further decline in the exchange rate like the price action from last month.
Australian Dollar Price Chart – AUD/USD Daily

Chart Prepared by David Song, Strategist; AUD/USD on TradingView
- AUD/USD registers a fresh yearly low (0.6358) after failing to defend the August low (0.6465), with a close below the 0.6380 (78.6% Fibonacci retracement) to 0.6410 (50% Fibonacci extension) region raising the scope for a move towards the November 2022 low (0.6272).
- At the same time, a move below 30 in the Relative Strength Index (RSI) is likely to be accompanied by a further decline in AUD/USD like the price action from last month, with a breach below the November 2022 low (0.6272) opening up 0.6240 (61.8% Fibonacci extension).
- Nevertheless, failure to test the November 2022 low (0.6272) may keep the RSI out of oversold territory, with a move above the 0.6510 (38.2% Fibonacci retracement) to 0.6520 (23.6% Fibonacci retracement) area bringing the 50-Day SMA (0.6595) on the radar.
Additional Market Outlooks
EUR/USD Post-NFP Weakness Brings Test of August Low
USD/JPY Outlook Mired by Failure to Test November 2022 High
--- Written by David Song, Strategist
Follow on Twitter at @DavidJSong


