Australian Dollar Outlook: AUD/USD
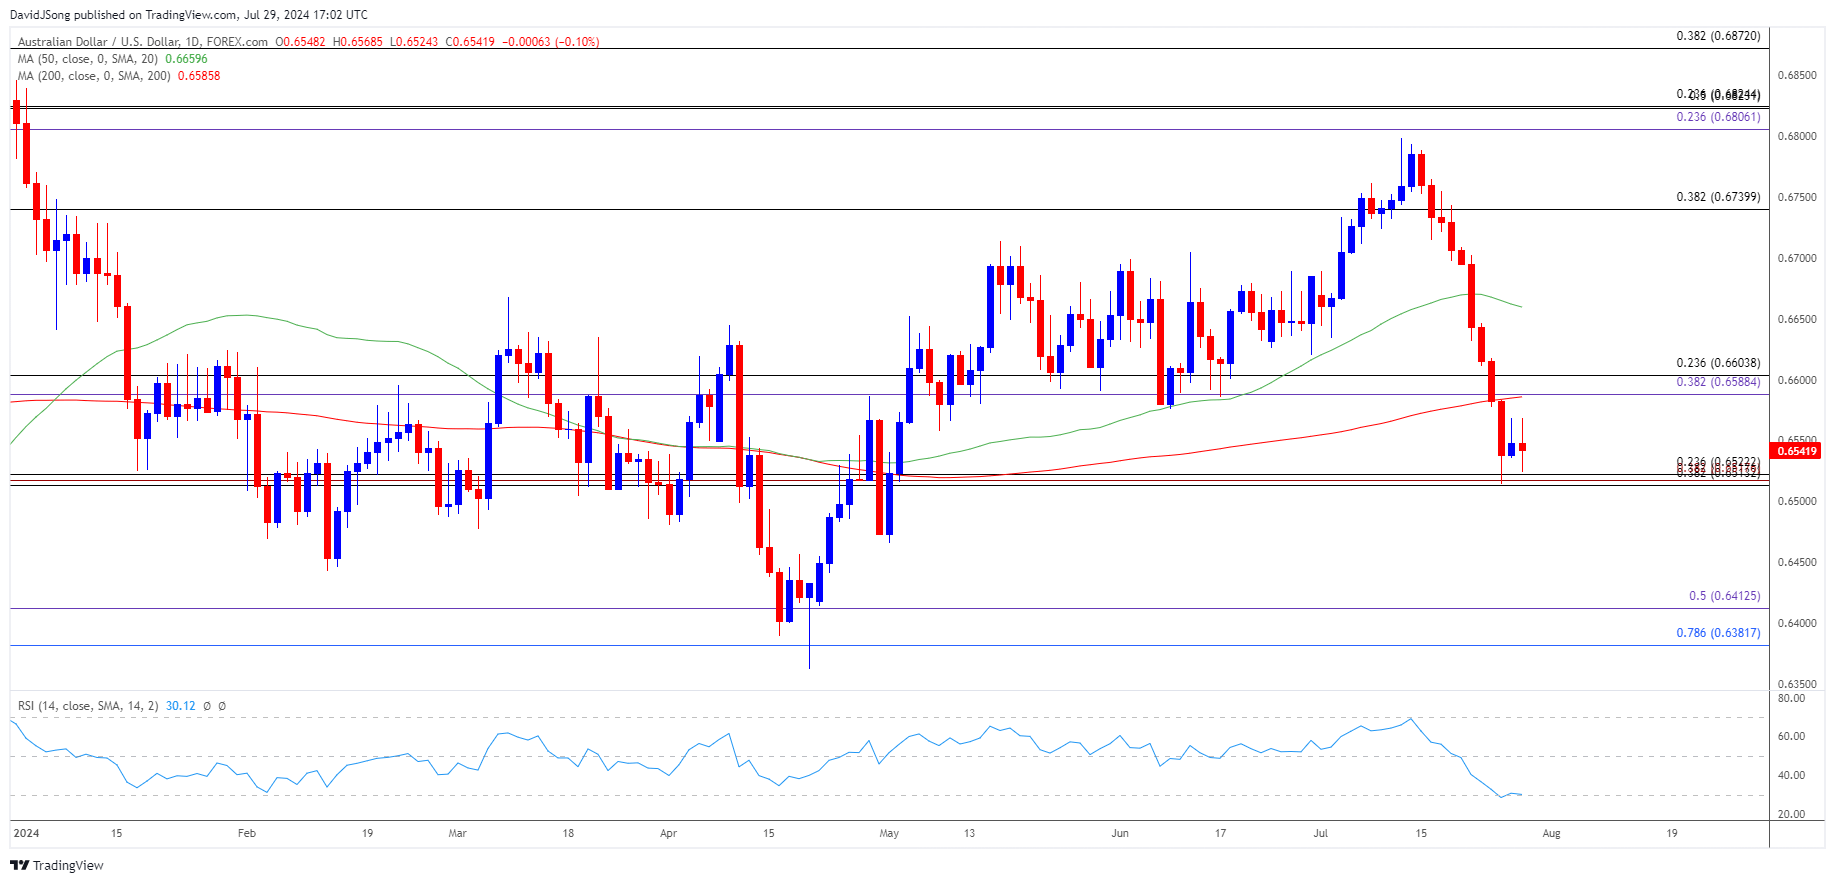
AUD/USD holds above the monthly low (0.6514) to pull the Relative Strength Index (RSI) back from oversold territory, but the update to Australia’s Consumer Price Index (CPI) may drag on the exchange rate may as the report is anticipated to show slowing inflation.
AUD/USD Forecast: RSI Recovers from Oversold Zone
AUD/USD appears to be stuck in a narrow range as it gives back the advance following the US Personal Consumption Expenditure (PCE) Price Index, and the exchange rate may consolidate ahead of the Reserve Bank of Australia (RBA) meeting on August 6 as it no longer carves a series of lower highs and lows.
Join David Song for the Weekly Fundamental Market Outlook webinar. Register Here
It seems as though the RBA is in no rush to switch gears as the central bank acknowledges that ‘it was still possible to achieve the Board’s strategy of returning inflation to target in a reasonable timeframe without moving away significantly from full employment,’ and Governor Michele Bullock and Co. may stick to a wait-and-see approach as ‘it was difficult either to rule in or rule out future changes in the cash rate target.’
Australia Economic Calendar

However, a downtick in Australia’s CPI may push the RBA to adjust its forward guidance as inflation falls towards the central bank’s 2-3% target range, and evidence of easing price growth may produce headwinds for the Australian Dollar as it fuels speculation for a change in regime.
At the same time, a higher-than-expected CPI print may keep the RBA on the sidelines as ‘returning inflation to target remains the Board’s highest priority,’ and signs of persistent price growth may curb the recent decline in AUD/USD as it raises the central bank’s scope to keep Australia interest rates higher for longer.
With that said, AUD/USD may consolidate over the remainder of the month as it no longer carves a series of lower highs and lows, but the Relative Strength Index (RSI) may show the bearish momentum returning should it fall back into oversold territory.
AUD/USD Price Chart – Daily

Chart Prepared by David Song, Strategist; AUD/USD on TradingView
- AUD/USD holds above the monthly low (0.6514) to pull the Relative Strength Index (RSI) out of oversold territory, and a move above the 0.6590 (38.2% Fibonacci extension) to 0.6600 (23.6% Fibonacci retracement) region may lead to a test of the 50-Day SMA (0.6660).
- A break/close above 0.6740 (38.2% Fibonacci retracement) brings the monthly high (0.6799) on the radar, but failure to defend the monthly low (0.6514) may push the RSI back below 30.
- A break/close below the 0.6510 (38.2% Fibonacci retracement) to 0.6520 (23.6% Fibonacci retracement) area may lead to a test of the May low (0.6456), with the next area of interest coming in around 0.6380 (78.6% Fibonacci retracement) to 0.6410 (50% Fibonacci extension).
Additional Market Outlooks
US Dollar Forecast: GBP/USD Tests Former Resistance Zone for Support
US Dollar Forecast: EUR/USD Rally Fizzles Ahead of March High
--- Written by David Song, Strategist
Follow on Twitter at @DavidJSong


