Australian Dollar Outlook: AUD/USD
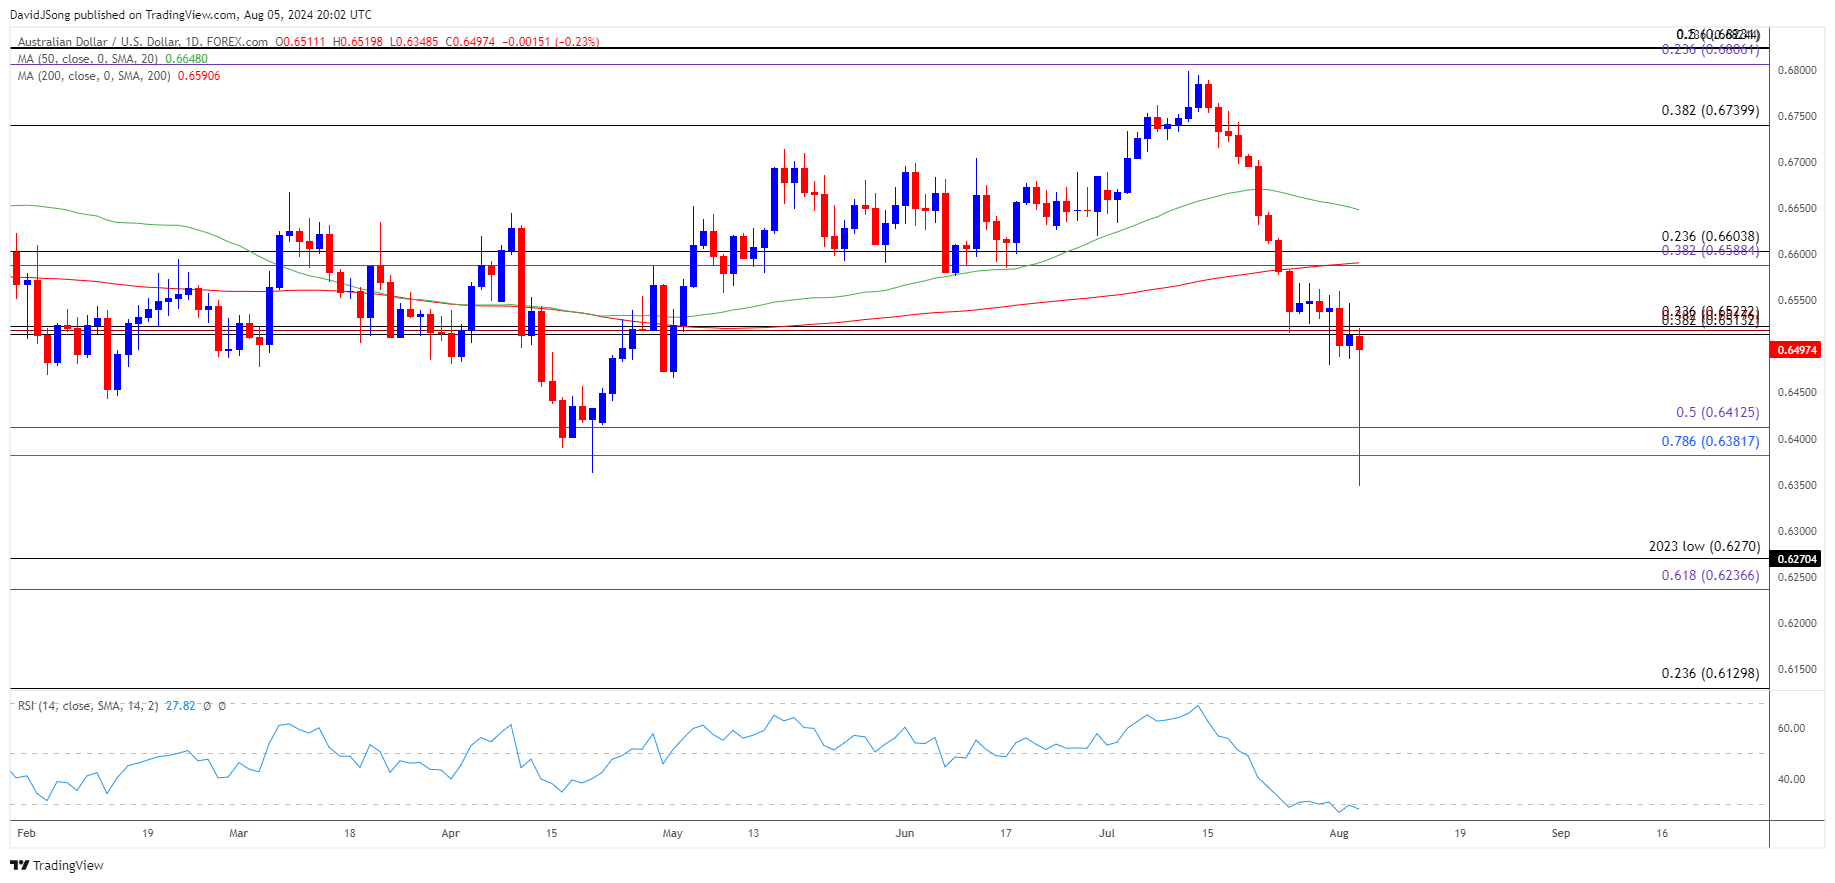
The recent depreciation in AUD/USD has pushed the Relative Strength Index (RSI) back into oversold territory.
AUD/USD Forecast: RSI Falls Back into Oversold Zone
AUD/USD extends the decline from the start of the month as the unwinding of the carry trade appears to be spurring a shift in risk sentiment, with the exchange rate clearing the April low (0.6362) to register a fresh yearly low (0.6349).
Join David Song for the Weekly Fundamental Market Outlook webinar. Register Here
The weakness in AUD/USD may persist as long as the RSI holds below 30, but the Reserve Bank of Australia (RBA) interest rate decision may influence the exchange rate as the central bank is expected to keep the cash rate at 4.35%.
AUD/USD Price Chart – Daily

Chart Prepared by David Song, Strategist; AUD/USD on TradingView
- AUD/USD may continue to trade to fresh yearly lows as the RSI falls back into oversold territory but need a close below the 0.6380 (78.6% Fibonacci retracement) To 0.6410 (50% Fibonacci extension) region to bring the 0.6240 (61.8% Fibonacci extension) to 0.6270 (2023 low) area on the radar.
- Next hurdle comes in around 0.6130 (23.6% Fibonacci retracement) but the RSI may show the bearish momentum abating should the oscillator struggle to hold below 30.
- Need a move above the 0.6510 (38.2% Fibonacci retracement) to 0.6520 (23.6% Fibonacci retracement) area for AUD/USD to snap the recent series of lower highs and lows, with a breach above the monthly high (0.6560) raising the scope for a move towards the 0.6590 (38.2% Fibonacci extension) to 0.6600 (23.6% Fibonacci retracement) region.
Additional Market Outlooks
US Dollar Forecast: USD/JPY Selloff Pushes RSI into Oversold Zone
US Dollar Forecast: EUR/USD Opening Range for August in Focus
British Pound Forecast: GBP/USD Pending Breakout
--- Written by David Song, Strategist
Follow on Twitter at @DavidJSong


