US Dollar Outlook: AUD/USD
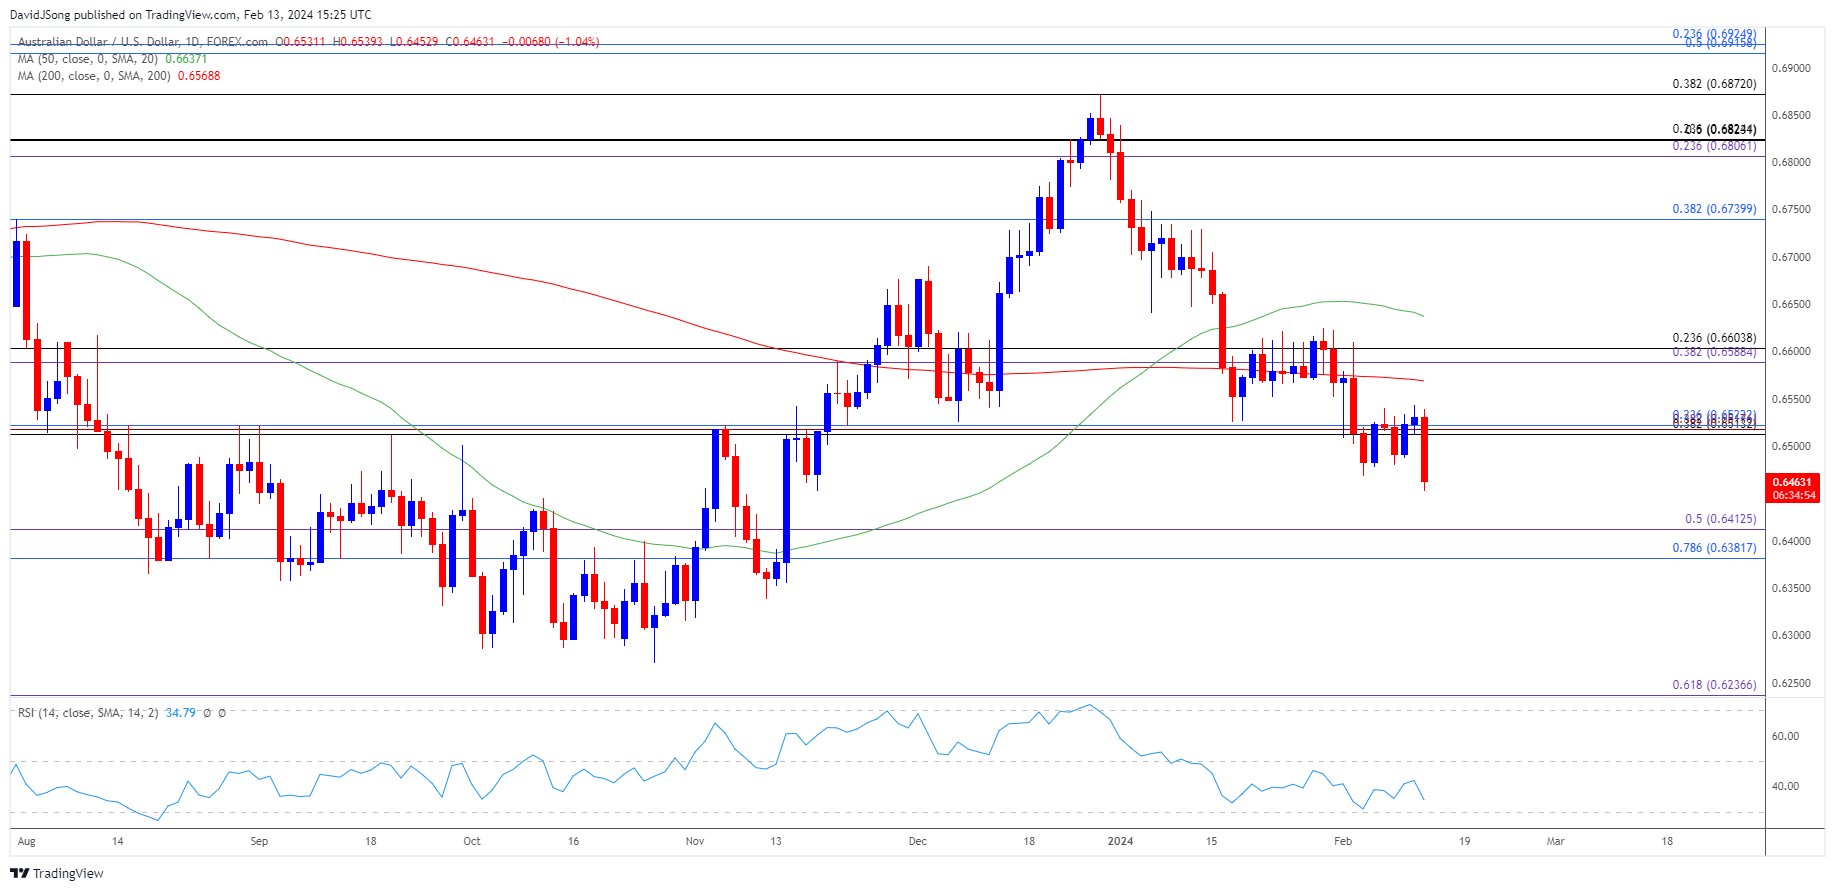
AUD/USD breaks below the opening range for February as the update to the US Consumer Price Index (CPI) reveals sticky inflation, and the exchange rate may continue to give back the advance from the November low (0.6318) as the 50-Day SMA (0.6637) develops a negative slope.
AUD/USD Breaks Below February Opening Range on Sticky US CPI
AUD/USD gives back the advance following the Reserve Bank of Australia (RBA) meeting as the headline US CPI prints at 3.1% in January versus forecasts for a 2.9% reading, while the core rate unexpectedly holds steady at 3.9% during the same period.
Join David Song for the Weekly Fundamental Market Outlook webinar. Register Here
Signs of persistent price growth may force the Federal Reserve to keep US interest rates higher for longer as Chairman Jerome Powell rules out a rate cut in March, and Fed officials may further combat inflation in 2024 as the economy shows little signs of a looming recession.
US Economic Calendar

However, the update to the US Retail Sales report may produce headwinds for the Greenback as private-sector spending is expected to contract 0.1% in January, and a material slowdown in household consumption may spur a dissent within the Federal Open Market Committee (FOMC) as officials forecast lower interest rates in 2024.
At the same time, a stronger-than-expected Retail Sales report may fuel the recent decline in AUD/USD as it encourages the FOMC to retain a restrictive policy, and the exchange rate may continue to give back the advance from the November low (0.6318) as the 50-Day SMA (0.6637) starts to reflect a negative slope.
With that said, recent developments in the moving average may indicate a potential change in the near-term trend as AUD/USD fails to defend the opening range for February, and a move below 30 in the Relative Strength Index (RSI) is likely to be accompanied by a further decline in the exchange rate like the price action from last year.
AUD/USD Price Chart – Daily

Chart Prepared by David Song, Strategist; AUD/USD on TradingView
- AUD/USD clears the opening range for February to register a fresh monthly low (0.6453), with the 50-Day SMA (0.6637) developing a negative slope amid the weakness in the exchange rate.
- Will keep a close eye on the Relative Strength Index (RSI) as it approaches oversold territory, with a move below 30 in the oscillator likely to be accompanied by a further decline in AUD/USD like the price action from last year.
- A break/close below the 0.6380 (78.6% Fibonacci retracement) to 0.6410 (50% Fibonacci extension) region opens up the November low (0.6318), with the next area of interest coming in around the 2023 low (0.6270).
- However, failure to break/close below the 0.6380 (78.6% Fibonacci retracement) to 0.6410 (50% Fibonacci extension) region may keep the RSI out of oversold territory, with a move above the 0.6510 (38.2% Fibonacci retracement) to 0.6520 (23.6% Fibonacci retracement) zone bringing the 0.6590 (38.2% Fibonacci extension) to 0.6600 (23.6% Fibonacci retracement) area on the radar.
Additional Market Outlooks
US Dollar Forecast: EUR/USD Susceptible to Another Test of December Low
US Dollar Forecast: USD/CAD Fails to Close Below 50-Day SMA
--- Written by David Song, Strategist
Follow on Twitter at @DavidJSong


