Weekly Technical Trade Levels on USD Majors, Commodities & Stocks
- Technical setups we are tracking into the weekly open- Core PCE data on tap Friday
- Next Weekly Strategy Webinar: Monday, September 30 at 8:30am EST
- Review the latest Video Updates or Stream Live on my YouTube playlist.
In this webinar we take an in-depth look at the technical trade levels for the US Dollar (DXY), US Treasury Yields (US10Y), Euro (EUR/USD), British Pound (GBP/USD), Australian Dollar (AUD/USD), Canadian Dollar (USD/CAD), Japanese Yen (USD/JPY), Swiss Franc (USD/CHF), Gold (XAU/USD), Crude Oil (WTI), Silver, (XAG/USD), S&P 500 (SPX500), Nasdaq (NDX) and the Dow Jones (DJI). These are the levels that matter on the technical charts heading into the weekly open.
Australian Dollar Price Chart– AUD/USD Daily

Chart Prepared by Michael Boutros, Sr. Technical Strategist; AUD/USD on TradingView
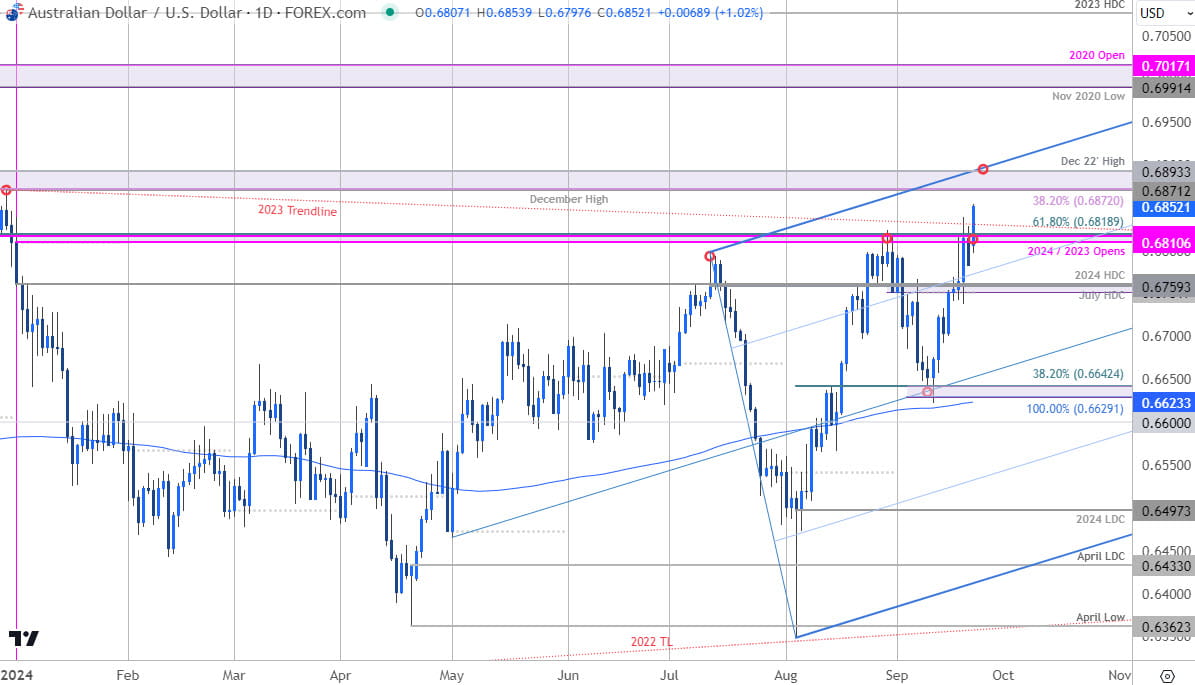
Aussie is threatening a breakout of a multi-year consolidation pattern extending off the June 2023 highs with AUD/USD rallying through key resistance today at 6810/19- a region defined by the 2023/2024 yearly opens and the 61.8% retracement of the 2023 decline. Note that we’ve adjusted the tail-end of this pitchfork to the May lows to better align with price, but the focus remains on a close today above this pivotal zone.
The next major resistance hurdle is eyed at the December high / 38.2% retracement of the broader 2021 decline / December 2022 swing high at 6872/93- look for a larger reaction there IF reached. Initial support now back at former resistance with bullish invalidation now raised to the objective monthly open at 6751. Keep in mind the RBA interest rate decision is on tap tonight.
Oil Price Chart – WTI Daily

Chart Prepared by Michael Boutros, Technical Strategist; WTI on TradingView
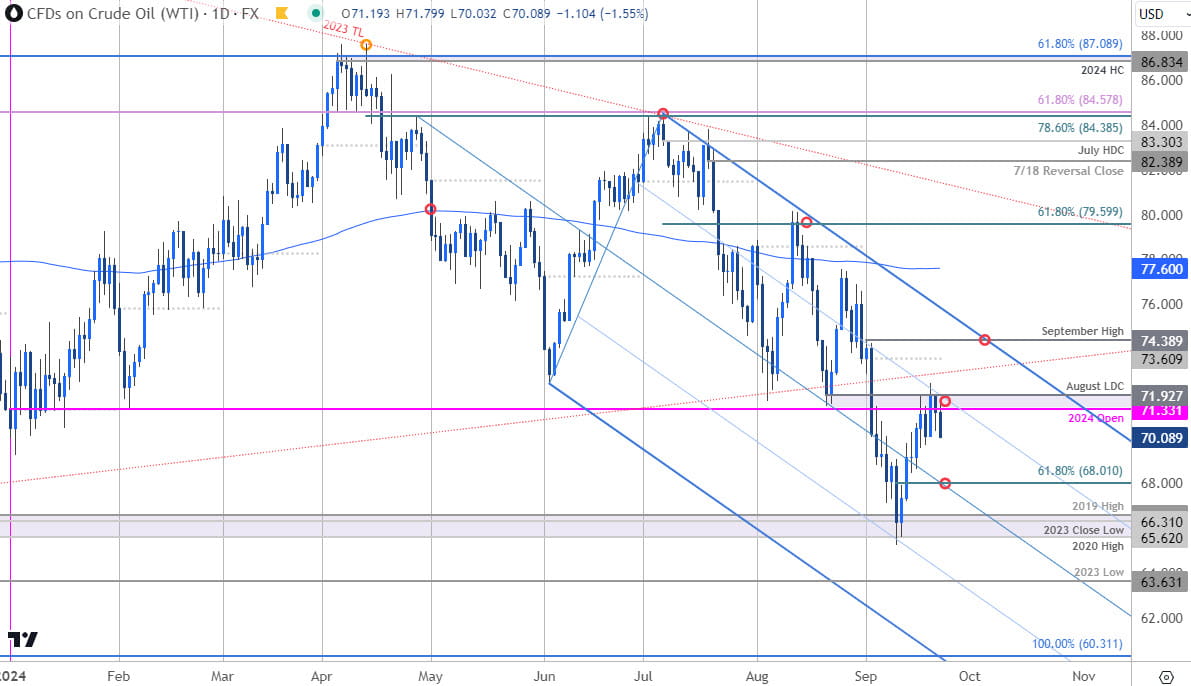
Oil opens the week just below a major pivot-zone we’ve been tracking for weeks now at the objective yearly open / August low-day close (LDC) at 71.33/93. Again, here the slope has recently been adjusted with the median-line now further highlighting this key technical zone. I
A topside breach / break above this threshold is needed to suggest a more significant low was registered this month with subsequent resistance objectives eyed at September open near 73.60 and the monthly opening-range high at 74.39 (broader bearish invalidation). Ultimately, losses would need to be limited to 68.01 IF price is heading for a breakout here.
Economic Calendar – Key USD Data Releases

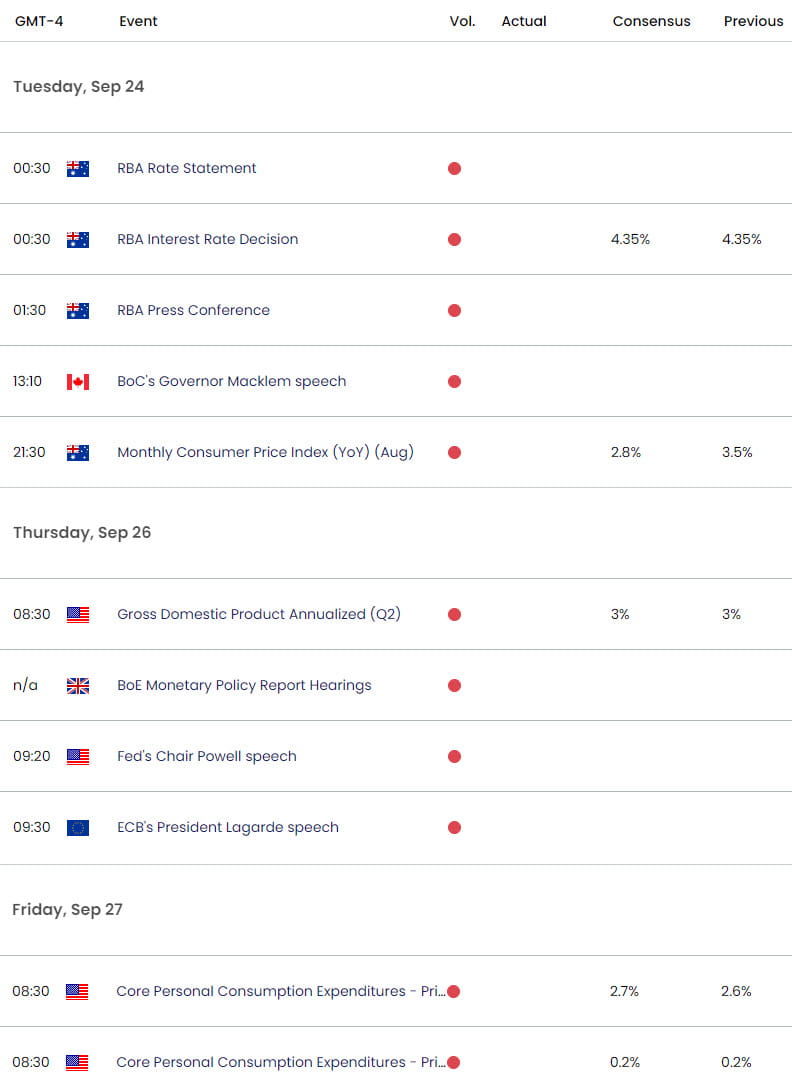
Economic Calendar - latest economic developments and upcoming event risk.
--- Written by Michael Boutros, Sr Technical Strategist with FOREX.com
Follow Michael on X @MBForex


