- AUD/USD falls to five-week lows
- Sentiment towards China looks to be an especially strong influence right now
- AUD/USD bearish momentum may stall near-term
- Selling rallies favoured in absence of reversal in China pessimism
AUD/USD has reverted to being a G10 FX China proxy, mirroring movements in the Chinese yuan and commodities heavily influenced by perceptions on how the world’s second-largest economy is faring, such as copper, iron ore and crude oil. Reflecting disappointment following China’s Third Plenum last week, the Aussie has sunk to five-week lows. Sitting on a key support zone, what happens next may determine how AUD/USD fares in the latter part of the year.
AUD/USD resumes roll as China proxy
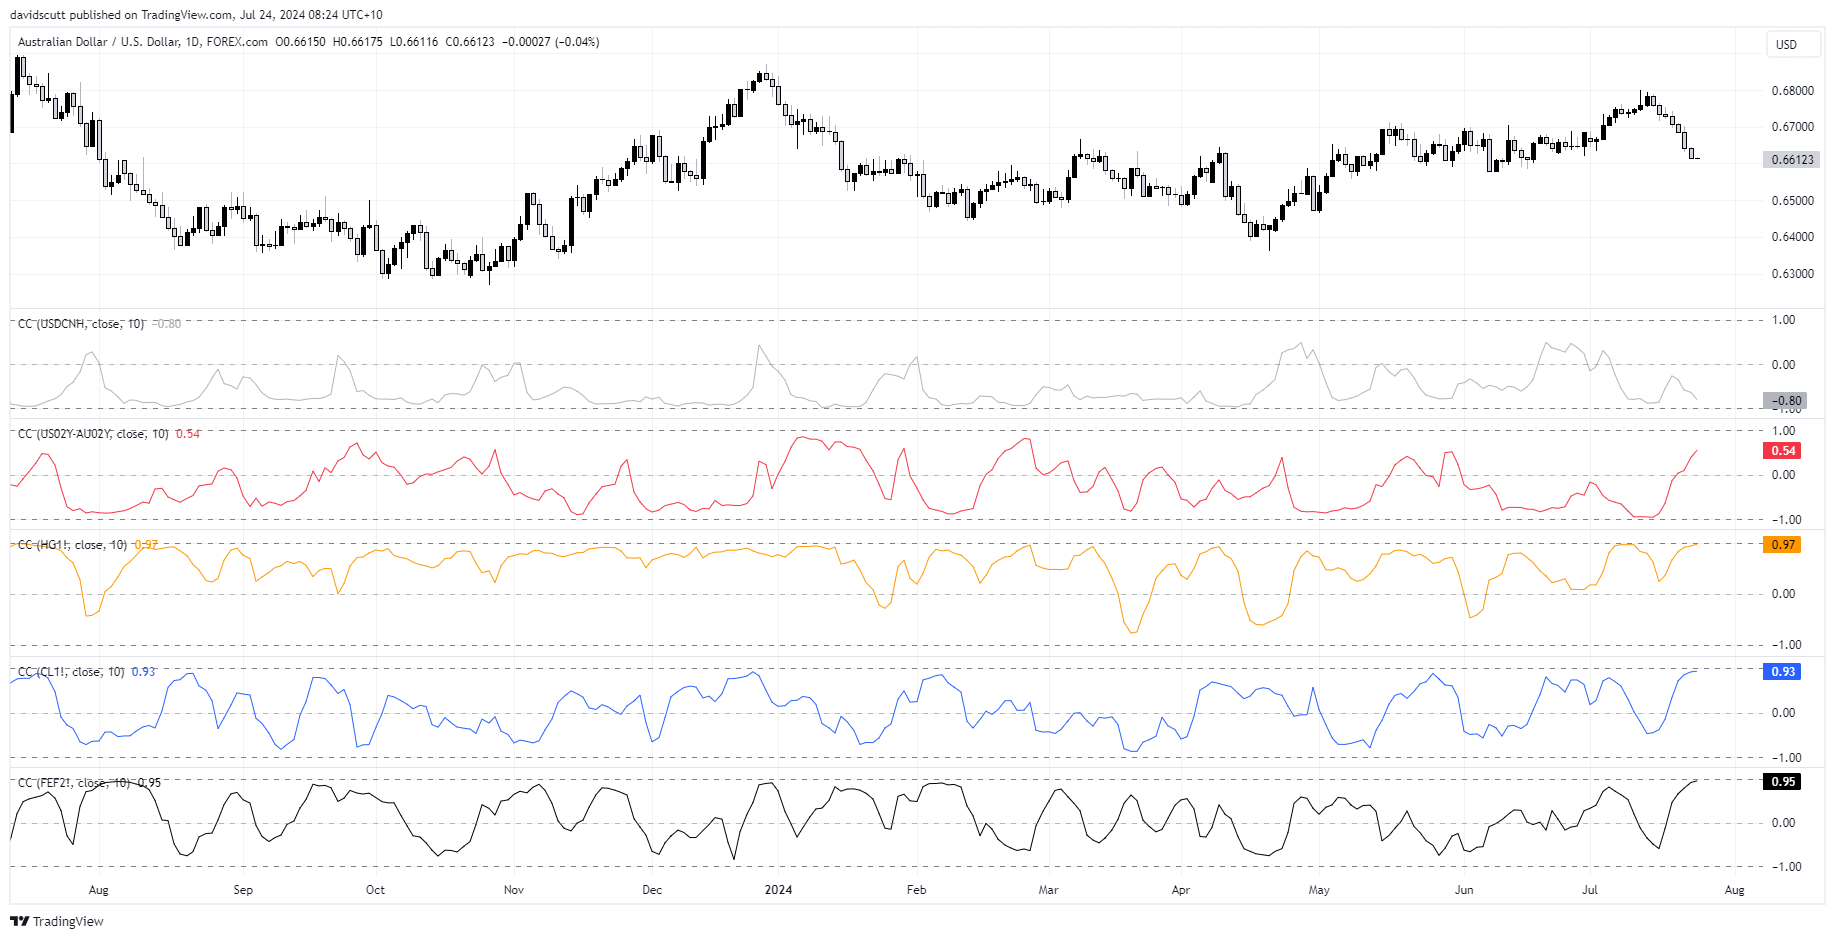
Those who have been following currencies for any period would know AUD/USD is often used as a China proxy given Australia’s cyclical nature and close economic ties with its neighbour to the north, especially when it comes to bilateral trade. But the reputation has gone into overdrive over the past fortnight with the correlation between AUD/USD with copper, crude oil and iron ore strengthening to levels rarely seen.
You can see that in the daily chart below with the correlation coefficient between AUD/USD with the three commodities sitting between 0.93 and 0.97 – basically in lockstep. The offshore-traded yuan has also been influential on the Aussie’s performance with the correlation with USD/CNH standing at -0.80 over the same period.

Put simply, sentiment towards China is overriding other influences on AUD/USD, including narrowing interest rate differentials with the United States which have helped strengthen other G10 FX names against the USD such as the Japanese yen, euro and British pound.
China data weak and consistently disappointing
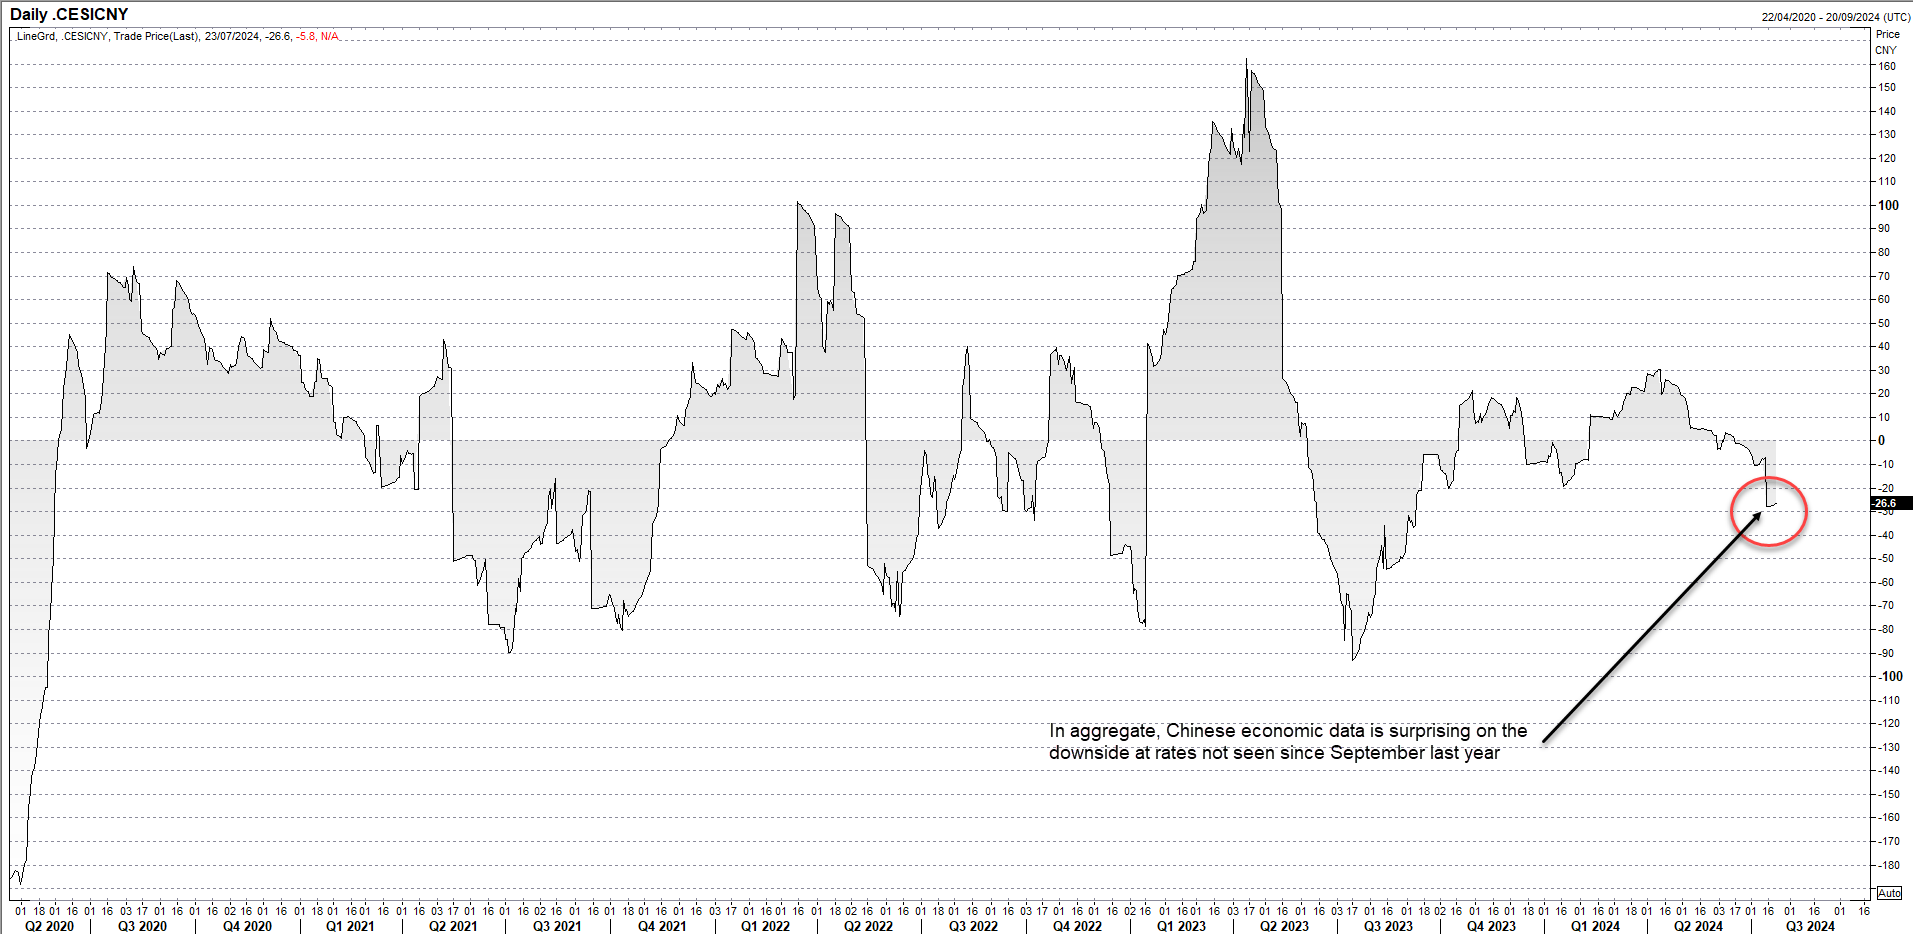
That means that unless its market drivers suddenly change, the path of least resistance for AUD/USD will likely be in the same direction as sentiment towards China. As seen in the chart below showing Citi’s China economic surprise index, even with substantially lowered expectations, the net flow of Chinese data is now surprising on the downside at rates not seen since September 2023.
For anyone trading AUD/USD, this indicator is worth monitoring for signals on whether to favour buying dips or selling rallies. Right now, it’s indisputably the latter.

Source: Refinitiv
AUD/USD hits important support zone
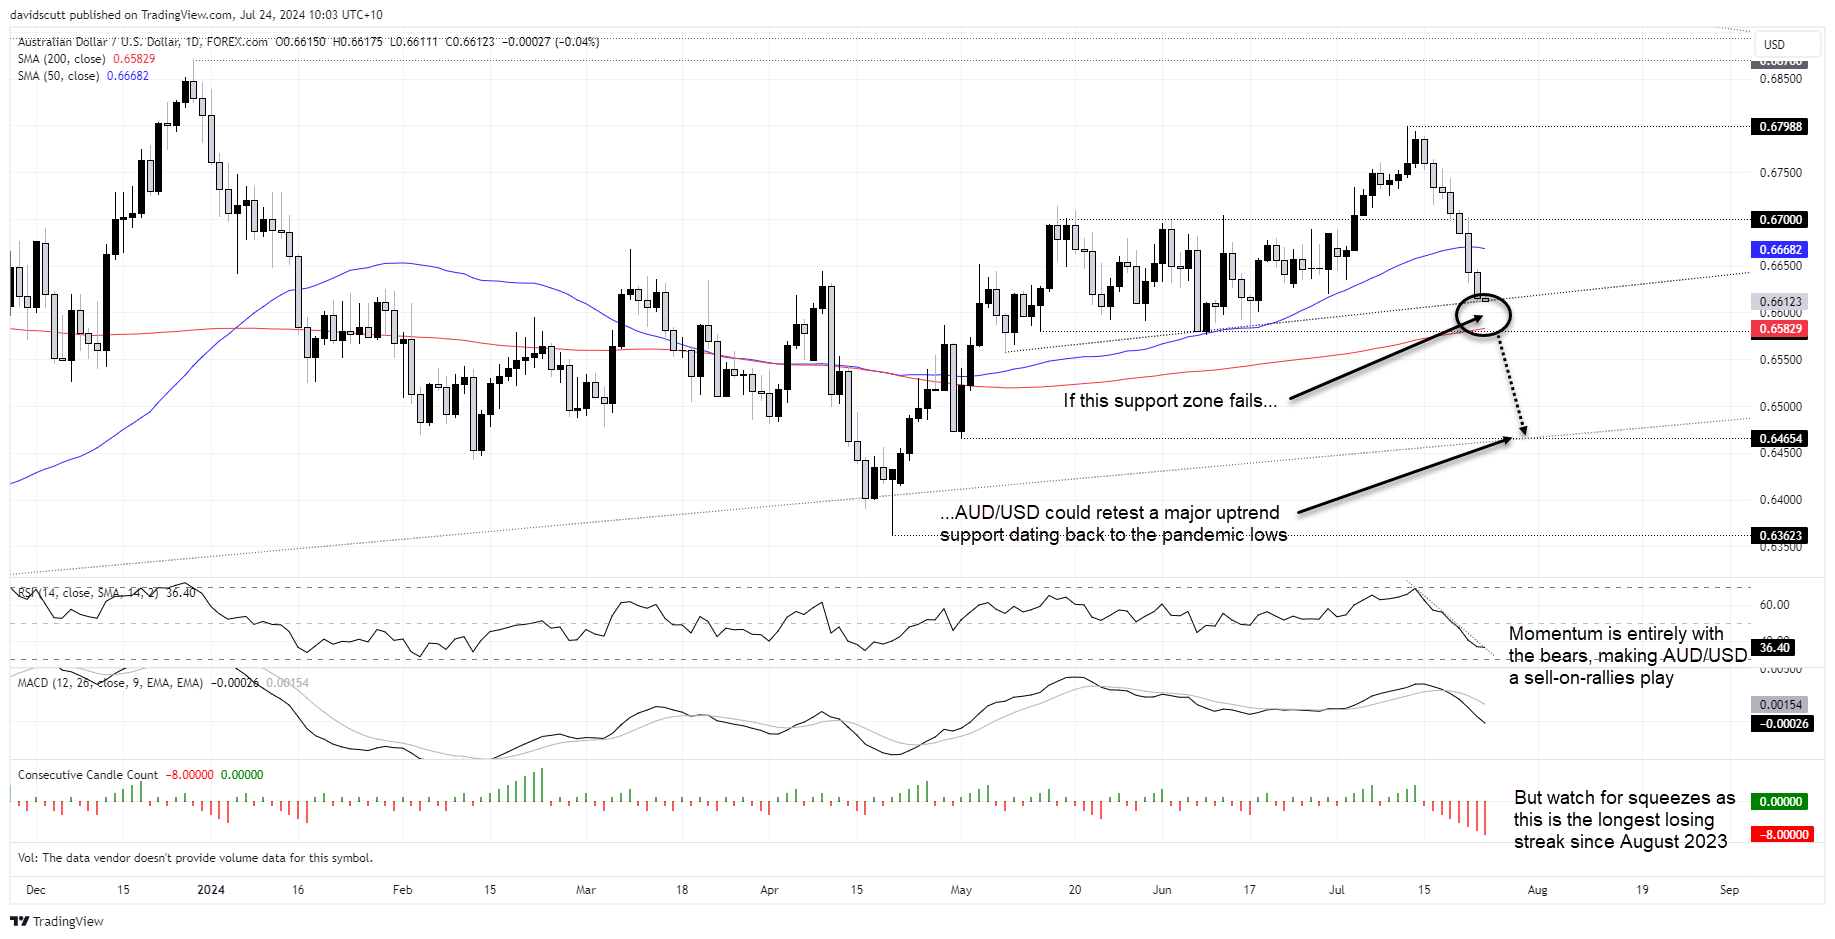
Looking at AUD/USD from a technical standpoint, the recent unwind has seen it fall to a support zone between .6610 to .6580, including the 200-day moving average. Having declined for seven consecutive sessions prior to today, the proximity of this support zone suggests we may see the bearish momentum stall near-term. But if it doesn’t, it will provide a huge tell on where the broader market sees AUD/USD going – lower.

Should the uptrend support give way, traders could consider initiating shorts with a tight stop above the level for protection. If it moves in your favour, consider using a trailing stop or lowering your stop to protect against reversal. The first target would be the bottom of the support zone at .6580. Beyond, bids may crop up around .6560 but there’s nothing significant until around .6465-70 – the intersection of minor horizontal support and major uptrend support dating back to the pandemic lows.
While there’s always the possibility AUD/USD could squeeze higher from the top of the support zone, unless accompanied by a stark turnaround in sentiment towards the Chinese economy, expecting any meaningful upside screens as a low probability play.
-- Written by David Scutt
Follow David on Twitter @scutty


