As shown on the dashboard, volatility was mostly contained overnight across most major asset classes. And this is no major surprise, given the lack of volumes in Asia due to Chinese New Year celebrations and a quiet economic calendar. All tracked USD pairs remained well within their typical daily ranges and, among FX crosses, only AUD/JPY and GBP/AUD exceeded their ATR’s (average daily ranges) to the benefit of a stronger Australian dollar.
As things stand, the USD remains the weakest currency pair of the week and we could find volatility remains subdued without a fresh catalyst.
Indices remain indecisive
The S&P500 was effectively flat again and produced Rikshaw man Doji candle (and inside day) to underscore indecision. Whilst there’s no immediate sell-signal or fundamental reason to panic, bulls are hesitant to push things higher for now. The Dow Jones set an intraday all-time high but also produced an indecision candle. The Nasdaq fared slightly better with a bullish close (albeit a small one) to produce another indecisive candle. Still, when volatility falls it can be an indication that it should rise again.
Oil and copper slip at the highs
WTI crude oil produced its first bearish candle in 8 days. Although we expected weakness from a technical perspective due to its testing the 100 and 200-month eMA’s. Brent also closed lower to produce a 3-bar bearish reversal pattern (evening star reversal) but we would prefer to see a break beneath $60 before considering counter-trend shorts.
Bullish momentum also waned on copper prices which had recently broken to an 8-year high. The trend remains firmly bullish but the potential for a corrective phase is apparent, so we’ll wait for a new level of support to build before reconsidering longs.
AUD/CAD about to break higher?

Commodity currencies have performed well in general, but the strength of the Australian dollar has continued to overpower the Canadian dollar overall and produced a nice, bullish trend on the daily chart. And this is despite the surging strength of oil prices and higher BOC overnight interest rate, which are supportive of the Canadian dollar.
The daily chart recently found support at the 50-day eMA, broke above a retracement line and produced a bullish engulfing candle on the daily chart. Closing just beneath 0.9855 resistance, we are waiting for a breakout in line with the dominant bullish trend. However, with the Jan 2021 and June 2018 high nearby for resistance we’d prefer to drop to a lower timeframe for bullish setups.

Dropping to the hourly chart shows the 20, 50 and 100-bar eMA’s are pointing higher, fanning out and providing dynamic support. Prices have also recently broken out of a corrective channel in line with bullish momentum and volume was rising during the recent swing higher.
- Bulls could wait for a break above 0.9855 before considering longs
- A more conservative approach is to wait for an hourly close above resistance, or wait to see if prices turn 0.9855 support into support.
- Initial target is just beneath 0.9900
- A break beneath the recent swing high invalidates the near-term bullish bias if prices have already broken above 0.9855 resistance
Watchlist update:
AUD/USD hit our initial target of the 0.7764 high as outlined in Monday’s report. The next major target is the 0.7820 high although the reward-to-risk ratio for longs on the daily chart are now debatable if not already long.
GBP/CHF continues to retrace towards the 1.2205 – 1.2260 support area highlighted in Tuesday’s report. We await a level of support to build before reconsidering longs. This could come in the form of a small bullish candle on the daily chart or a bullish reversal pattern on an intraday timeframe.
EUR/USD has traded slightly higher since bullish engulfing breakout seen in Wednesday’s report. A break below 1.2043 invalidates the bullish bias.
USD/CHF continues to consolidate around recent lows. The bias remains bearish beneath 0.8950 although we’d prefer to fade into rallies beneath the resistance zone highlighted yesterday’s report.
Up Next (Time in Sydney GMT +11)

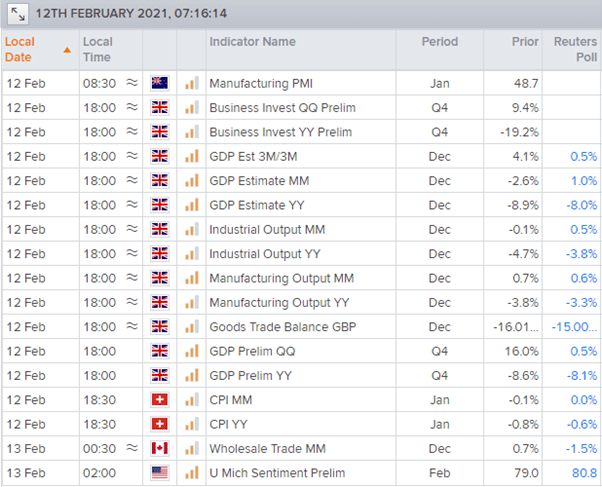
- PMI data for New Zealand is up shortly. Given the weakness we have seen this week on NZD after it hit multi-month highs and the noteworthy pickup of short interest in the weekly COT (commitment of traders report) on NZ futures, then the Kiwi dollar may be more vulnerable to bad news than previously.
- A host of data from the UK is the highlight of the UK session which includes business investment, GDP, industrial and manufacturing output. Clearly this puts GBP pairs and the FTSE 100 into focus for news traders, although the main driver behind the British pound’s strength is the BOE effectively ruling out negative rates at their last meeting (hence the break to multi-year highs against the greenback this week).


