Hammer candlesticks

Learn what hammer candlesticks are and how they can support your forex trading decisions.

What is a hammer candlestick?

  • Considered a reversal formation and forms when price moves well below open, but then rallies to close near open if not higher. (inverted hammer is the mirror opposite)
  • Forms a candlestick with a long lower shadow (tail), and a small body with little or no wick–looks like a hammer, or mallet. (inverted hammer is the mirror opposite)
  • Depending on the previous trend, a hammer may be referred to as a hanging man or shooting start, but the same concept applies. Bullish or bearish bias depends on previous price swing, or trend.
    • A hammer after an uptrend is called a hanging man.
    • An inverted hammer after an uptrend is called a shooting star.
Hammer Inverted Hammer OR OR OR OR

Why are hammer candlesticks important?

  • May act as a leading indicator suggesting a shift in bullish/bearish momentum
  • Completed hammers may help to either confirm, or negate, a potential significant high or low has occurred. –price drives higher or lower “hammering” out a top or bottom before closing back towards open
  • Significance increases with length of shadow (ideally 2-3 times the size of the body) as well as timeframe
  • Hammers may also help confirm, or strengthen, other reversal indicators (i.e. may occur as part of tweezer formation, or next to doji, etc.)
  • A hammer “fails” when new high is achieved immediately after completion (candle), and a hammer bottom “fails” if next candle achieves new low.
    • A hammer “fails” when new high is achieved immediately after completion (candle), and a hammer bottom “fails” if next candle achieves new low.

Example 1 - AUD/USD - 5min


AUD/USD - 5min - Hammer (Same as above, but zoomed in)


AUD/USD - 5min - Shooting star (Same as above, but zoomed in)
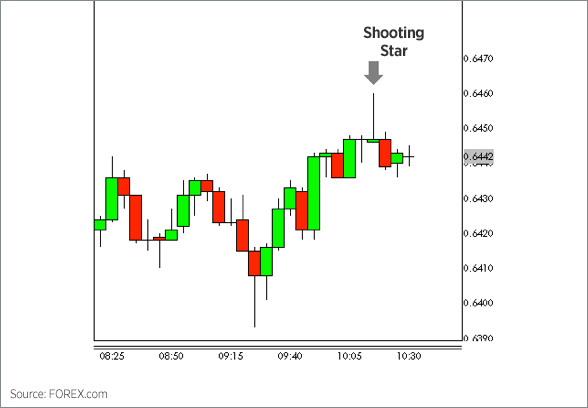


Example 2 – USD/CAD – Daily
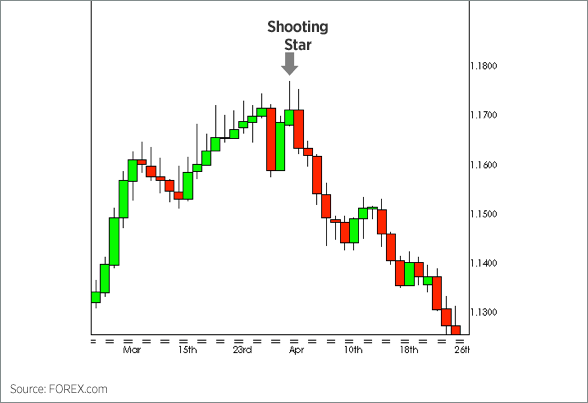


Example 3 – USD/CAD – Daily


Example 4 – USD/JPY – 4hour

In the following 4 hour chart of USD/JPY, a hammer formed near an ascending trendline that represents a support level, suggesting of a possible continuation.


Given that the hammer did not break the trendline, we receive our confirmation to enter the trade. We buy USD/JPY at 99.60, while placing our stop-loss slightly below the ascending trendline at 99.30.


The pair rallies in line with our desired direction, advancing over 90 pips before breaking the trendline. We exit our position upon the close below ascending trendline, allowing us to attain a healthy 3:1 reward to risk ratio.

The information on this web site is not targeted at the general public of any particular country. It is not intended for distribution to residents in any country where such distribution or use would contravene any local law or regulatory requirement. The information and opinions in this report are for general information use only and are not intended as an offer or solicitation with respect to the purchase or sale of any currency or CFD contract. All opinions and information contained in this report are subject to change without notice. This report has been prepared without regard to the specific investment objectives, financial situation and needs of any particular recipient. Any references to historical price movements or levels is informational based on our analysis and we do not represent or warranty that any such movements or levels are likely to reoccur in the future. While the information contained herein was obtained from sources believed to be reliable, author does not guarantee its accuracy or completeness, nor does author assume any liability for any direct, indirect or consequential loss that may result from the reliance by any person upon any such information or opinions.

Futures, Options on Futures, Foreign Exchange and other leveraged products involves significant risk of loss and is not suitable for all investors. Losses can exceed your deposits. Increasing leverage increases risk. Spot Gold and Silver contracts are not subject to regulation under the U.S. Commodity Exchange Act. Contracts for Difference (CFDs) are not available for US residents. Before deciding to trade forex, commodity futures, or digital assets, you should carefully consider your financial objectives, level of experience and risk appetite. Any opinions, news, research, analyses, prices or other information contained herein is intended as general information about the subject matter covered and is provided with the understanding that we do not provide any investment, legal, or tax advice. You should consult with appropriate counsel or other advisors on all investment, legal, or tax matters. References to FOREX.com or GAIN Capital refer to StoneX Group Inc. and its subsidiaries. Please read Characteristics and Risks of Standardized Options.