Singapore Dollar / Hong Kong Dollar - SGD/HKD

View indicative pricing, trading opportunities, latest research and market insights for SGD/HKD.

Price Chart

SGD/HKD rate chart

Price 5.79235
Change % 0.00%

SGD/HKD market insights

Pivot Points
TradingView
Performance Analytics
Test

When you trade your FOREX.com account on TradingView.com, you benefit from sharing ideas with their community of over 50 million traders, investors, and analysts in addition to their industry-leading charts and tools.

Whether you are new to trading or a seasoned investor, TradingView delivers on our joint mission to help anyone succeed in financial markets.

When it comes to trading, it’s just as important to assess your own behaviours as well as the market’s. More than a modern-day trading journal, simply log into our trading platform and select the Performance Analytics tab for in-depth insights on your strengths and weaknesses.

SGD/HKD overview

Overview
Costs & Margins
  • SGD/HKD is an exotic forex pair representing how many Hong Kong dollars equal one Singaporean dollar. HKD is linked to the US dollar, so this pair is negatively correlated to USD/SGD. This means when the value of USD/SGD rises, SGD/HKD will drop and vice versa. 

    Behind China, Singapore and Hong Kong both host some of the largest shipping ports in the world, so disruptions to global trade or monetary policy in either region will affect the rate of SGD/HKD. Singapore’s top exports are small electronics and financial services. Hong Kong’s main exports are textiles and electrical machinery. Supply chain issues involving microprocessors and other complex circuitry can also strongly affect trade for both regions.

  • Margin From
    20.0 %
  • Trading Hours
    24 hours / day *
  • Min Trade Size
    1000
  • Long
    -0.73
  • Short
    -0.48
  • Min Stop Distance
    0.0 Points
  • Spreads
  • Spreads From
    0.0035 Points
  • Margins
  • 0 - 13000 000
    20.0 %
  • 13000 000 - 26000 000
    30.0 %
  • 26000 000 +
    40.0 %
  • Dealing
  • Spreads
    0.0035 Points
  • Margins
  • 0 - 13000 000
    20.0 %
  • 13000 000 - 26000 000
    30.0 %
  • 26000 000 +
    40.0 %

The technical analysis indicator and related information are provided by TradingView, Inc. This content is being provided for informational purposes only and does not constitute a recommendation to buy or sell products offered by FOREX.com. Prices used to prepare the indicators may be different from the pricing available in your FOREX.com trading account. FOREX.com has not independently verified this information. This indicator should not be used in isolation to make trading decisions.

Check out our live market analysis


Join our analysts as they cover key market movements and drivers, always wrapping up with a Q&A session.

Watch FOREX.com analysis on

Economic Calendar
Forex explained
What is forex?

Forex is the process by which traders can buy one currency and simultaneously sell another, with the goal to profit from the direction price is likely to take in the future. With a daily trading volume of more than £5.1 trillion, the forex market is the most traded in the world, and is open 24 hours a day, five days a week, between Sunday 5PM EST to Friday 5PM EST for banks, institutions and individuals worldwide.

Read more on what is forex.

Was this answer helpful?
Why trade forex

People trade forex for a range of reasons, including the unmatched liquidity of the market, the ability to trade on leverage, the opportunity to take positions in both rising and falling markets, the lack of hidden fees or commissions, and the accessibility of markets being open 24 hours a day, five days a week, between Sunday 5PM EST to Friday 5PM EST.

Read more about why to trade forex.

Was this answer helpful?
How to trade forex

In order to trade forex, there are a few key steps to follow. First, you need to select a currency pair. Many traders choose a major pair such as EUR/USD due to high liquidity. Next, analyzing the market is key to understanding the technical and fundamental drivers that may affect price. Once you understand how to read the quote, it's time to open your position by going long or short.

You'll need to monitor your trade, with many traders using technical indicators to make better sense of price action, and features such as stops and limits to manage risk. Finally, you can close your position when the market hits a price at which you want to exit.

Read more about how to trade forex.

Was this answer helpful?

If you have more questions visit the Forex Trading FAQ section or start a Chat with our support team.

Looking to learn more about forex trading? Visit our trading academy and use our resources to become market-ready.
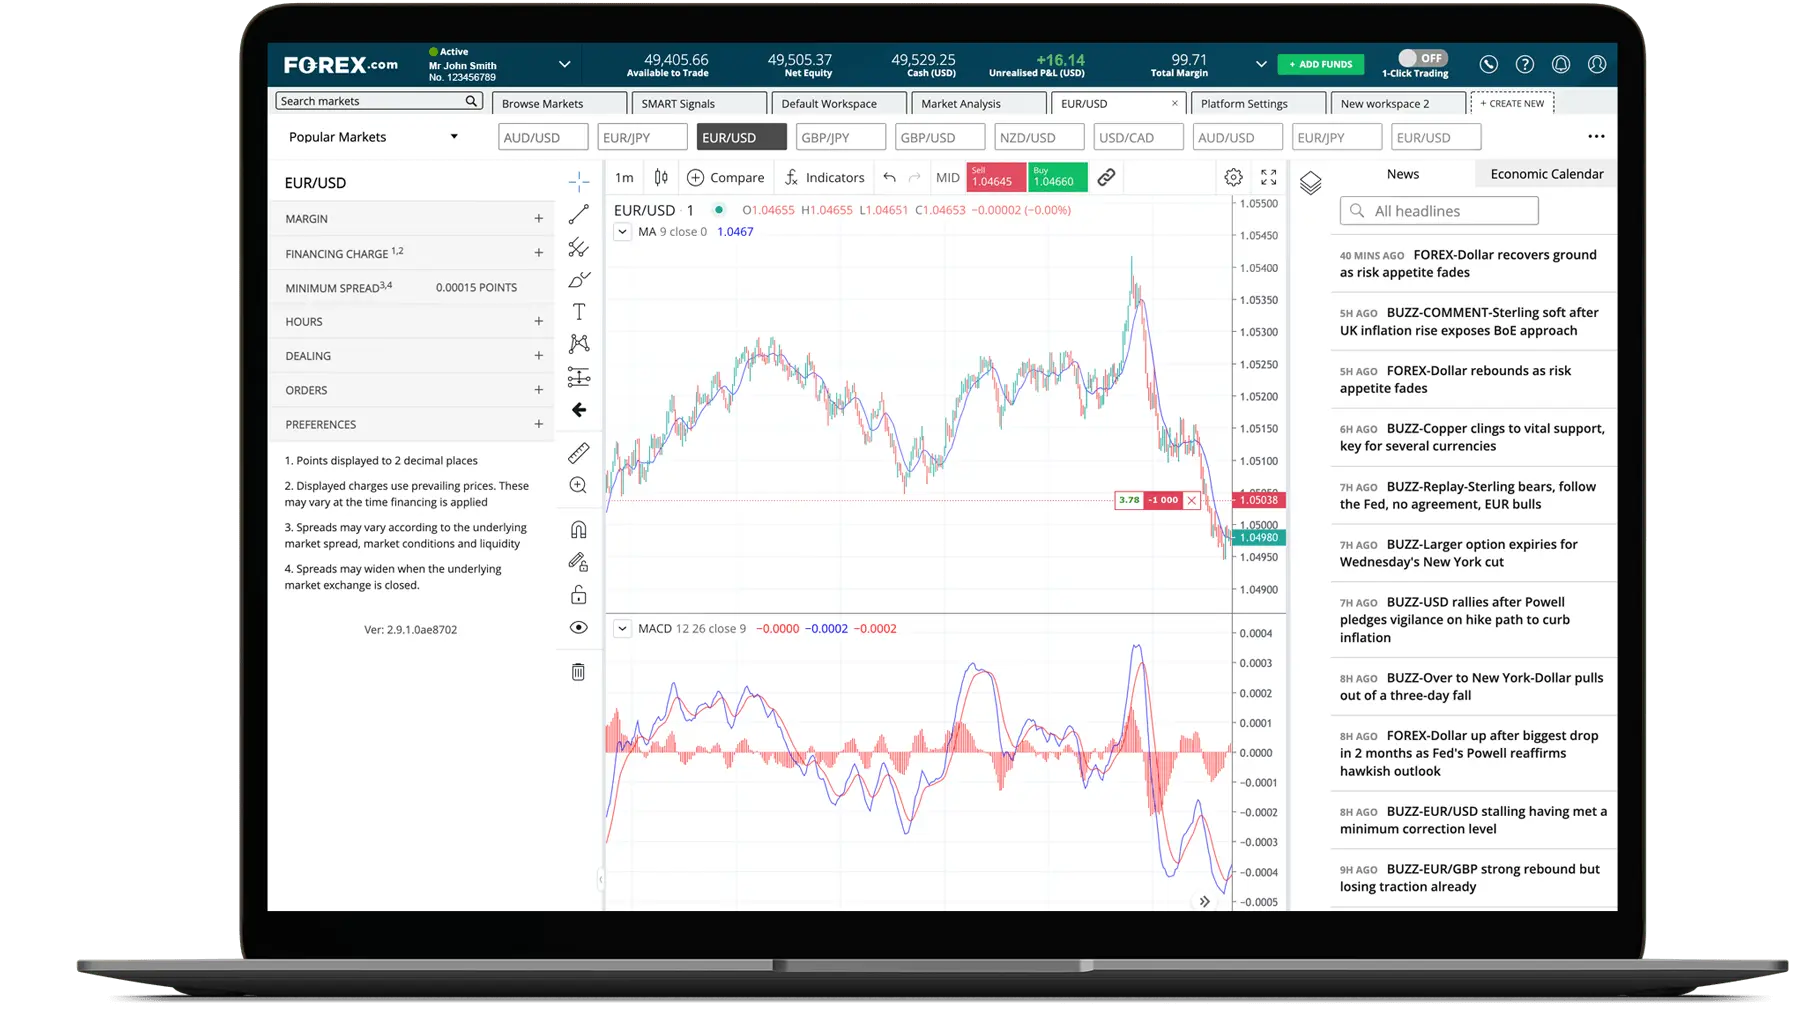
Laptop showing Forex Webtrader platform