TradingView charts
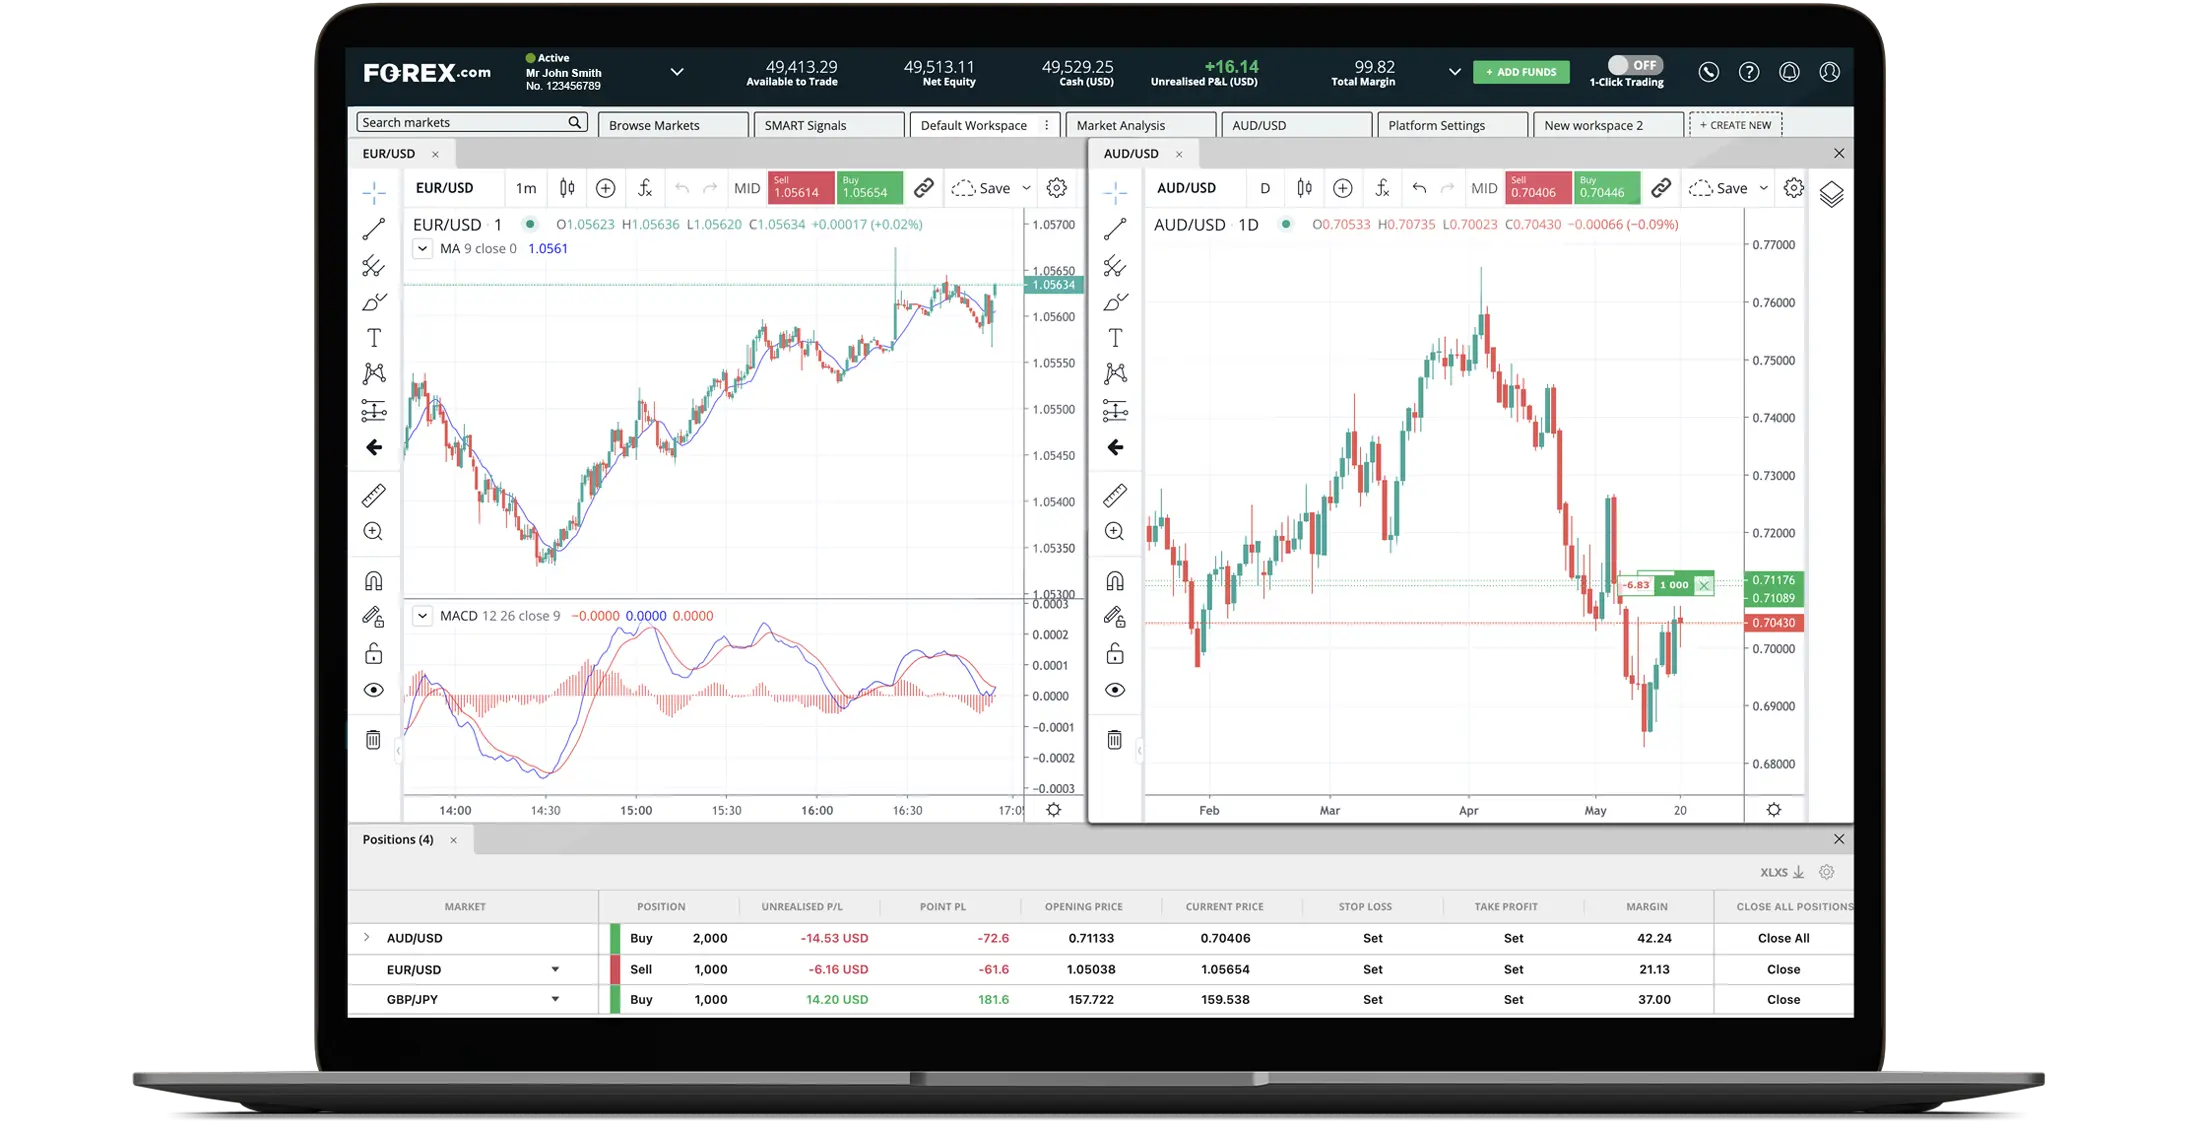
Clear and user-friendly, our advanced charts are packed with features and ideal for traders who love technical analysis. Available on both mobile and web platforms.
Get total control
-
Trade from chartsCreate new orders directly from the charts and click and drag to edit existing orders.
-
Over 80 technical indicatorsFrom Bollinger Bands to MACD to Parabolic SAR, use a wealth of customisable indicators that can be saved to match your trading style.

Identify trends
-
14 time intervalsIdentify trading patterns using chart time intervals ranging from 1-minute through to daily or monthly time frames. Quickly zero in on a chart area of interest using the ‘zoom region’ feature.
-
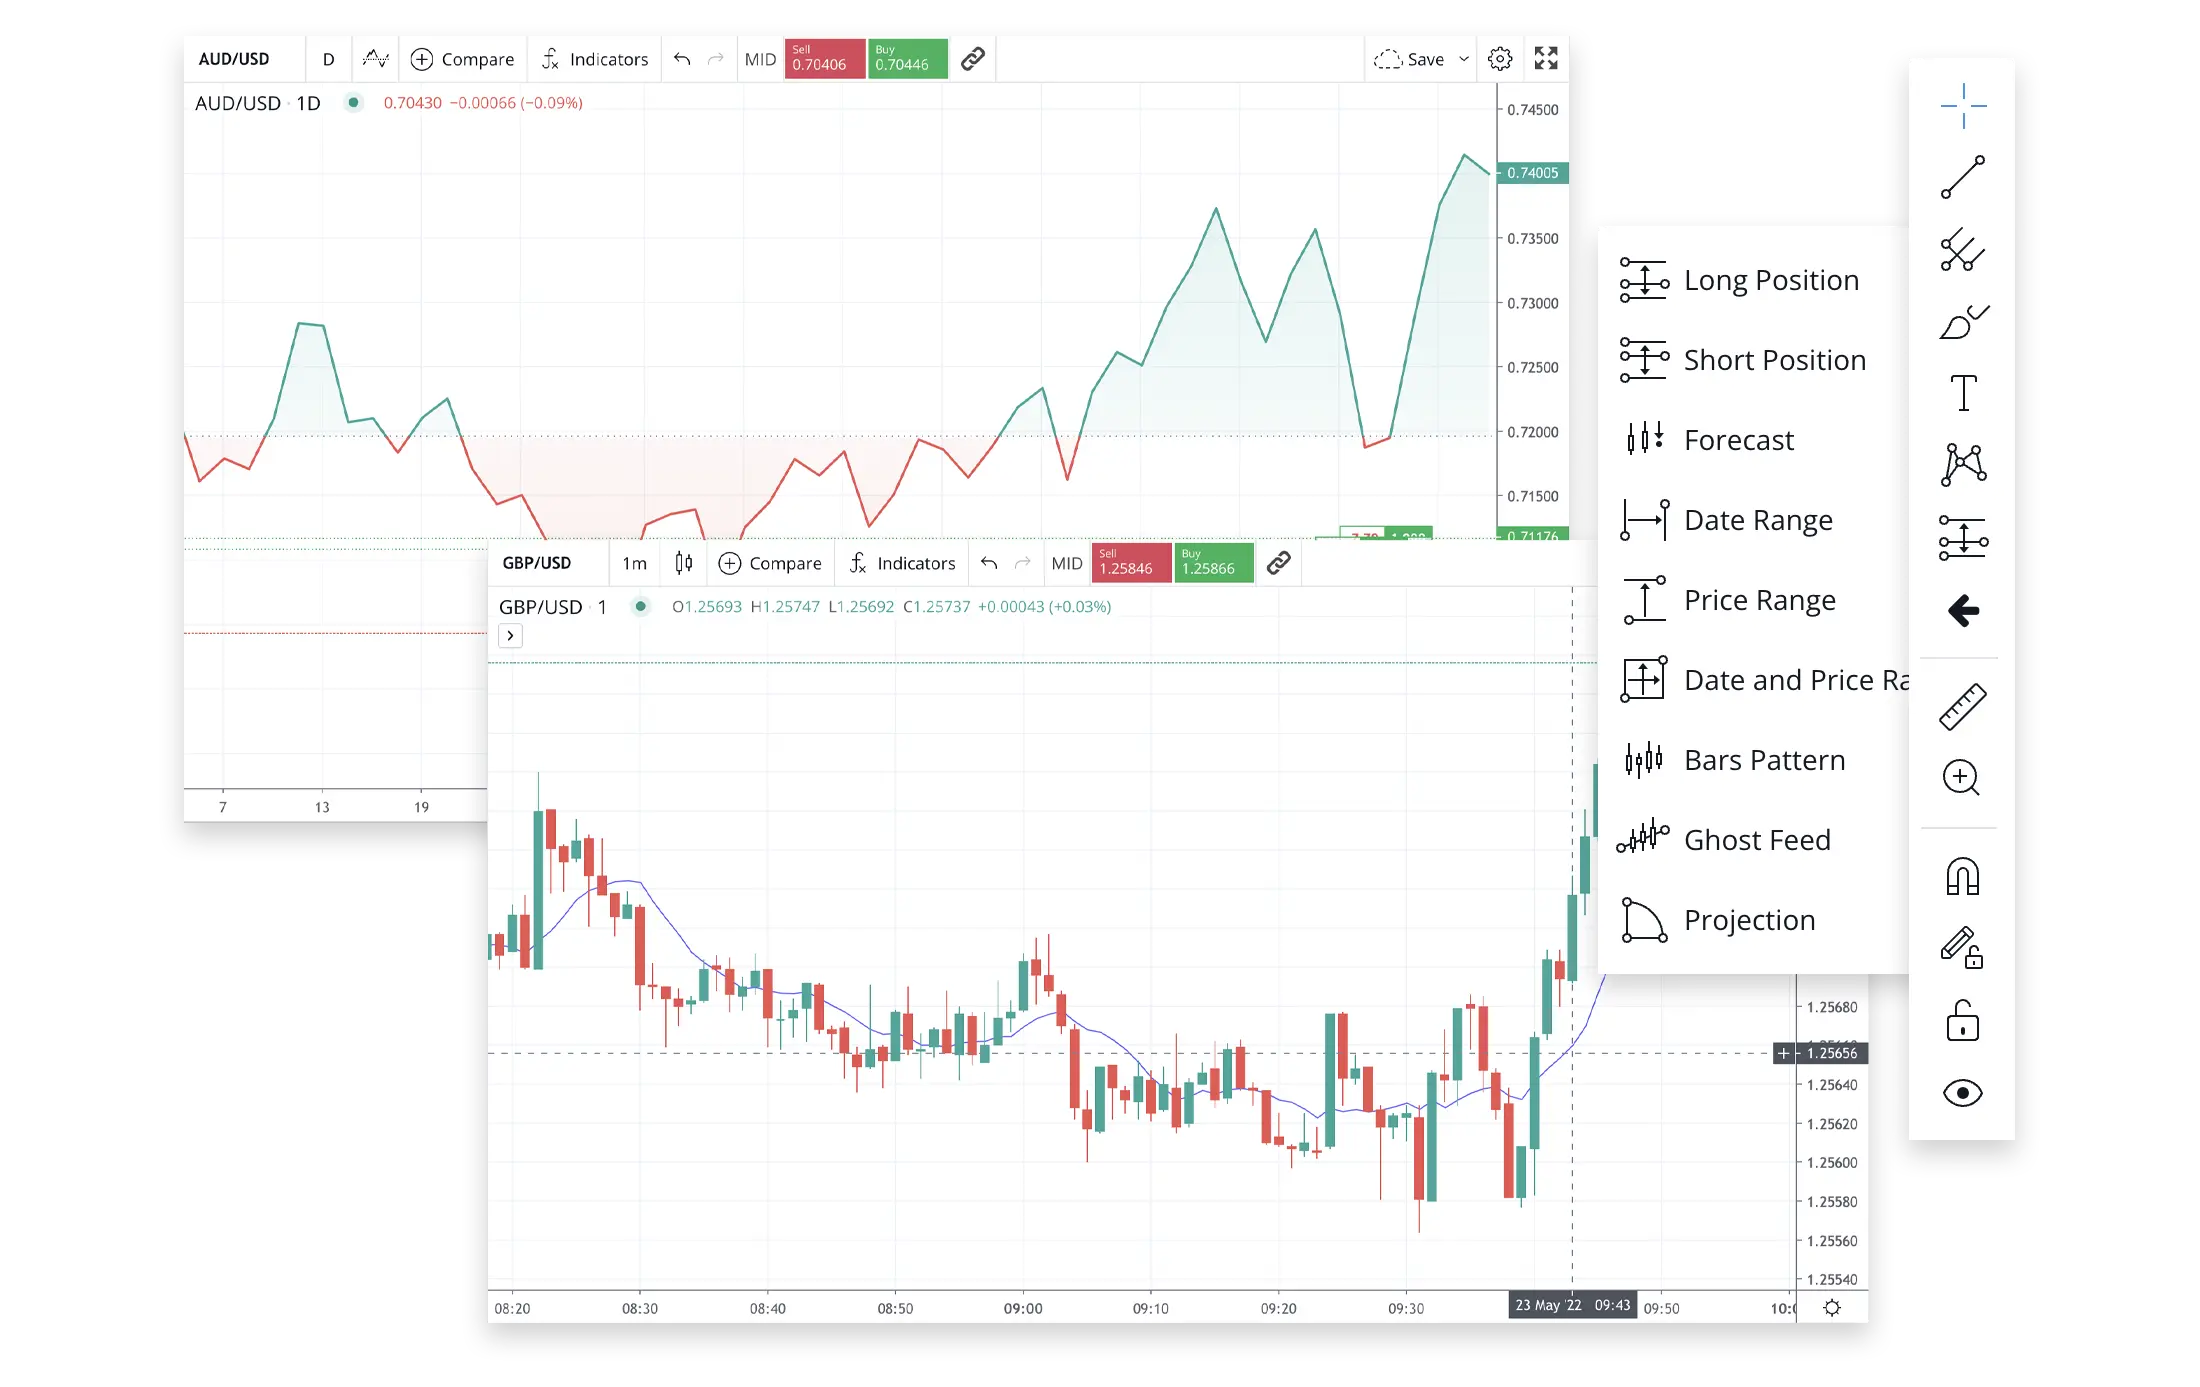
Multiple chart typesChoose from a variety of chart styles, customise what information you see, and the look of the trend lines.

Choose your chart type
-
Over 50 drawing toolsPlan your next trade with customisable charting and drawing tools that come with handy ‘undo’ and ‘redo’ buttons.
-
Customisation featuresTailor everything from the indicators and visibility options and save it as a template.

FAQs
What is backtesting?
Backtesting is applying a trading strategy to historical market data in order to help determine how valid the trading strategy is.
You can backtest in the FOREX.com desktop platform using its Development Studio.
Was this answer helpful?
What are charting tools and how do I use them?
Charting tools help you analyse a market using the charts within a trading platform.
For a walkthrough on using charting tools in MetaTrader 4, click here.
Was this answer helpful?
What are technical indicators and how do I use them?
Indicators are metrics used to help identify trends or support/resistance levels within a market.
For a walkthrough on using indicators in MetaTrader 4, click here.
For a walkthrough on using indicators in MetaTrader 4, click here.
Was this answer helpful?
If you have more questions visit the Charts FAQ section or start a Chat with our support