Mastering shares and indices
Stock index trading strategies
In the final lesson in this course, let's examine which strategies and styles work when trading share indices.
Indices vs other markets
Stock indices don't really work like other financial markets.
Take a look at the chart below, comparing the performance of the S&P 500, Wall Street and the DAX to gold and Eurodollar in the 2010s. Notice the difference?

Barring a few notable bear runs, the indices have one clear trajectory: up. The currency and commodity, on the other hand, are much more rangebound over the period.
When you consider what an index is, this fact isn't all that surprising. Indices represent economies, which tend to grow (with occasional recessions). In a similar way, indices tend to move up in price (with occasional corrections).
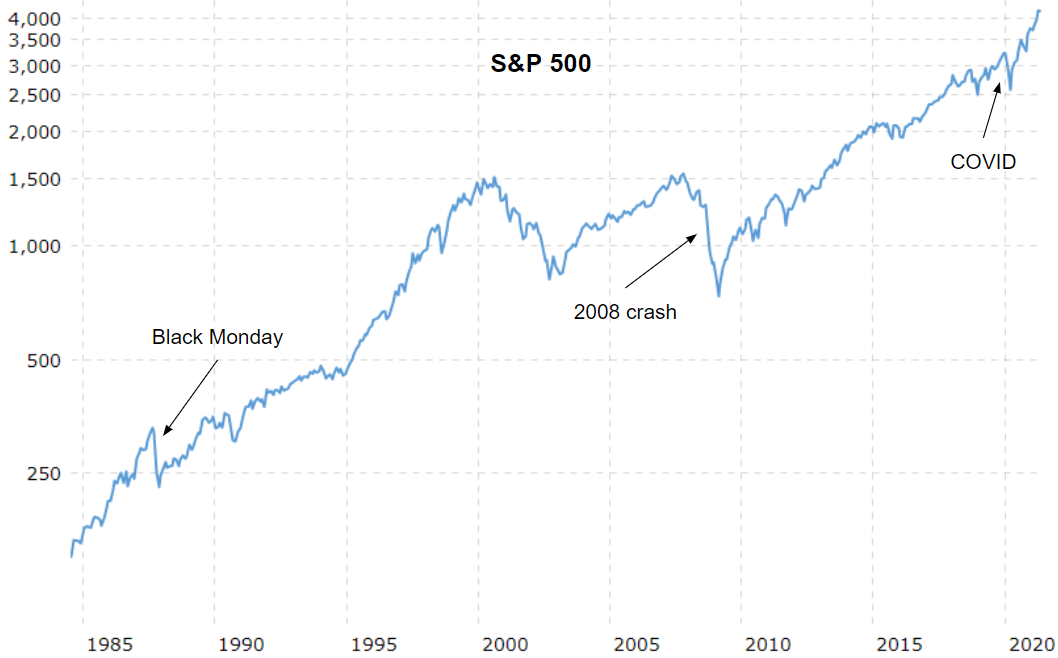
In the 30 years from 1990-2020, for example, the FTSE 100 posted a positive annual return 19 times. The DJIA and DAX did the same 22 times; the S&P, 21.

Which trading styles work on indices?
Despite – or perhaps because of – their difference to stocks, currencies and commodities, indices are used by traders of pretty much any style.
Thanks to their regular returns, they're popular among long-term position traders. Using investments like exchange-traded funds, these traders can take a position on an entire index without buying each individual stock.
However, like any financial market, an index's price movement is rarely linear. Sellers can step in at any moment, which provides ample oscillations that swing traders can use to drive medium-term profits.
A typical swing trade on an index would be to wait for a small retracement after a breakout, then buy before the bull move resumes once more.
Alternatively, you could use Bollinger bands. If your index drops below the lower band into oversold territory, then it might be about to bounce back – providing a buy opportunity.
Short-term day traders and scalpers, meanwhile, often focus on indices. They use CFDs to take advantage of the high volatility offered by the world's top indices. Again, though, most tend to build their strategy around bullish moves.
Learn more about trading styles.
Shorting and corrections
But what about when a stock index does embark on a bear run? Stock market crashes and index corrections can be a tempting prospect for traders, offering the chance of a 'big short' for big profits.
For example:
- On Black Monday in 1987, the Dow Jones and S&P 500 both shed more than 20% of their total price in a single day.
- In the 2008 crash, the DJIA fell 1,800 pts in a week. It went on to drop by 54% in 17 months.
- In 2020, COVID concerns caused the sharpest crash since 1987. The FTSE fell 10.8% in one session, while the DAX fell by 12.2%.

These drops were far sharper than the climbs that preceded them. A correctly timed short position ahead of any of these events would have brought huge profits.
Traders often say that indices 'Take the escalator on the way up, but the elevator on the way down!'
However, getting that timing correct is incredibly tricky. Markets can run at irrationally high levels for a long time, and analysts may predict a correction months or even years before it actually arrives.
Of course, you could open a short trade and wait for the reversal to arrive. But you'd have to make sure that your losses don't see you put on margin call, forcing you to close your position before you see any profit.
Predicting the timing of a crash is extremely difficult, but there are tools that traders use to spot when one is on the way. The Volatility Index (VIX), for instance, uses options prices to measure the market's current fear level. If the VIX is high, then sellers might be about to take over.
Alternatively, skyrocketing P/E levels are seen by some as an indication of a market bubble that is likely to pop soon. But again, they won't tell you when.
