Article Outline
- Week Ahead: Trump Returns, Earnings, BOJ Decision, and Flash PMIs
- Technical Analysis: USDJPY and Nasdaq (3-Day Time Frames)
- Technical Analysis (TA) Tips: Wicks
Trump Returns
Donald Trump is set to take office on Monday, January 20th, while U.S. markets will be closed for a holiday. With promises of implementing drastic policies from day one, irregular volatility risks are a key concern. These policies are expected to impact global economies gradually, but unexpected developments could introduce significant risk factors.
Earnings
Positive earnings reports from U.S. banks and Taiwan Semiconductor this week have boosted momentum in U.S. indices. Next week’s earnings-related volatility may center on Netflix’s results, scheduled for Wednesday. The Nasdaq remains in an upward trajectory, holding above the 21,000-mark despite sharp downside wicks on the chart.
Ahead of major tech earnings in the final week of January, several events are likely to influence volatility:
- PBOC monetary policies (Monday)
- Netflix earnings (Wednesday)
- Manufacturing and Services PMIs (Friday)
- World Economic Forum (throughout the week)
PBOC and BOJ Decisions
China’s economy continues to exceed expectations, with stimulus-driven loan prime rates under the spotlight. These measures could amplify global economic trends, though Trump’s tough policies may challenge this momentum. Meanwhile, the Japanese Yen remains in a critical state, with intervention risks looming. Market expectations lean toward a 25 bps rate hike from the BOJ, adding pressure to the USDJPY pair.
Technical Analysis: Quantifying Uncertainties
USDJPY Analysis: 3 Day Time Frame – Log Scale

Source: Tradingview
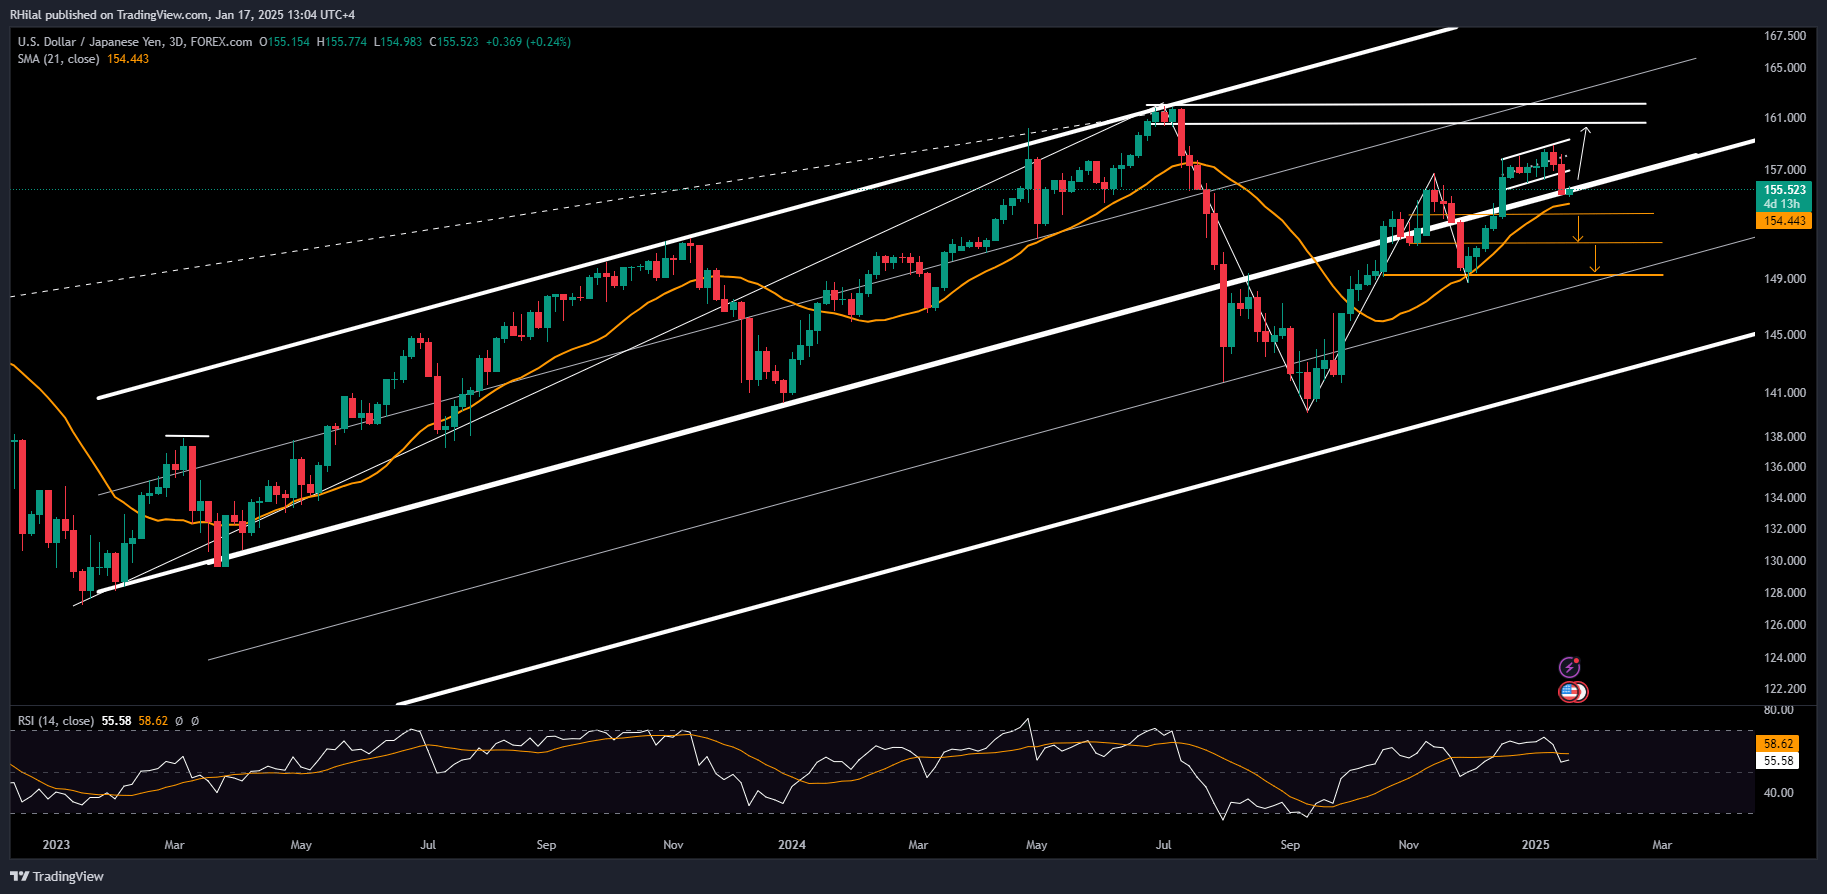
The USDJPY pair is holding onto the lower border of its primary up-trending channel, which has been intact since January 2023 and extends to August 2024. The current border, supported by the 21-period simple moving average at 153.60, is preventing further declines.
Key Levels to Watch:
- Downside: A firm close below 153.60 could extend bearish drops toward 151.60 and 149.00.
- Upside: Holding above 154.00 may propel the pair toward 159.00, 160.00, and 162.00, where heightened volatility and BOJ intervention risks are likely.

Source: Tradingview
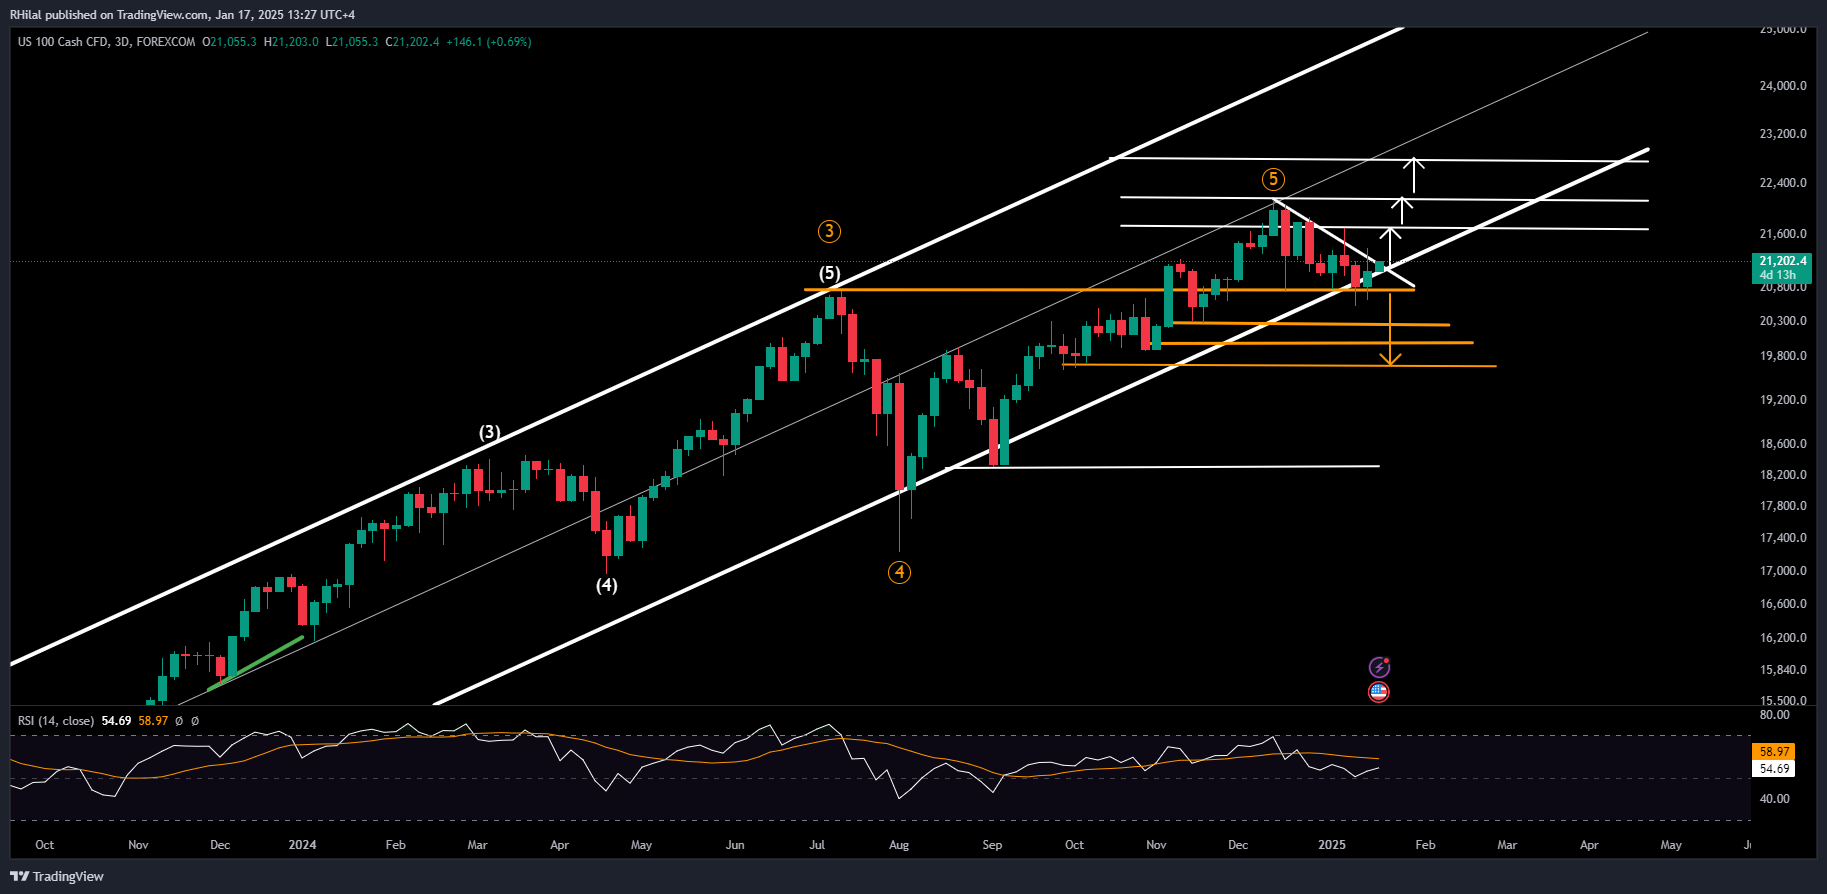
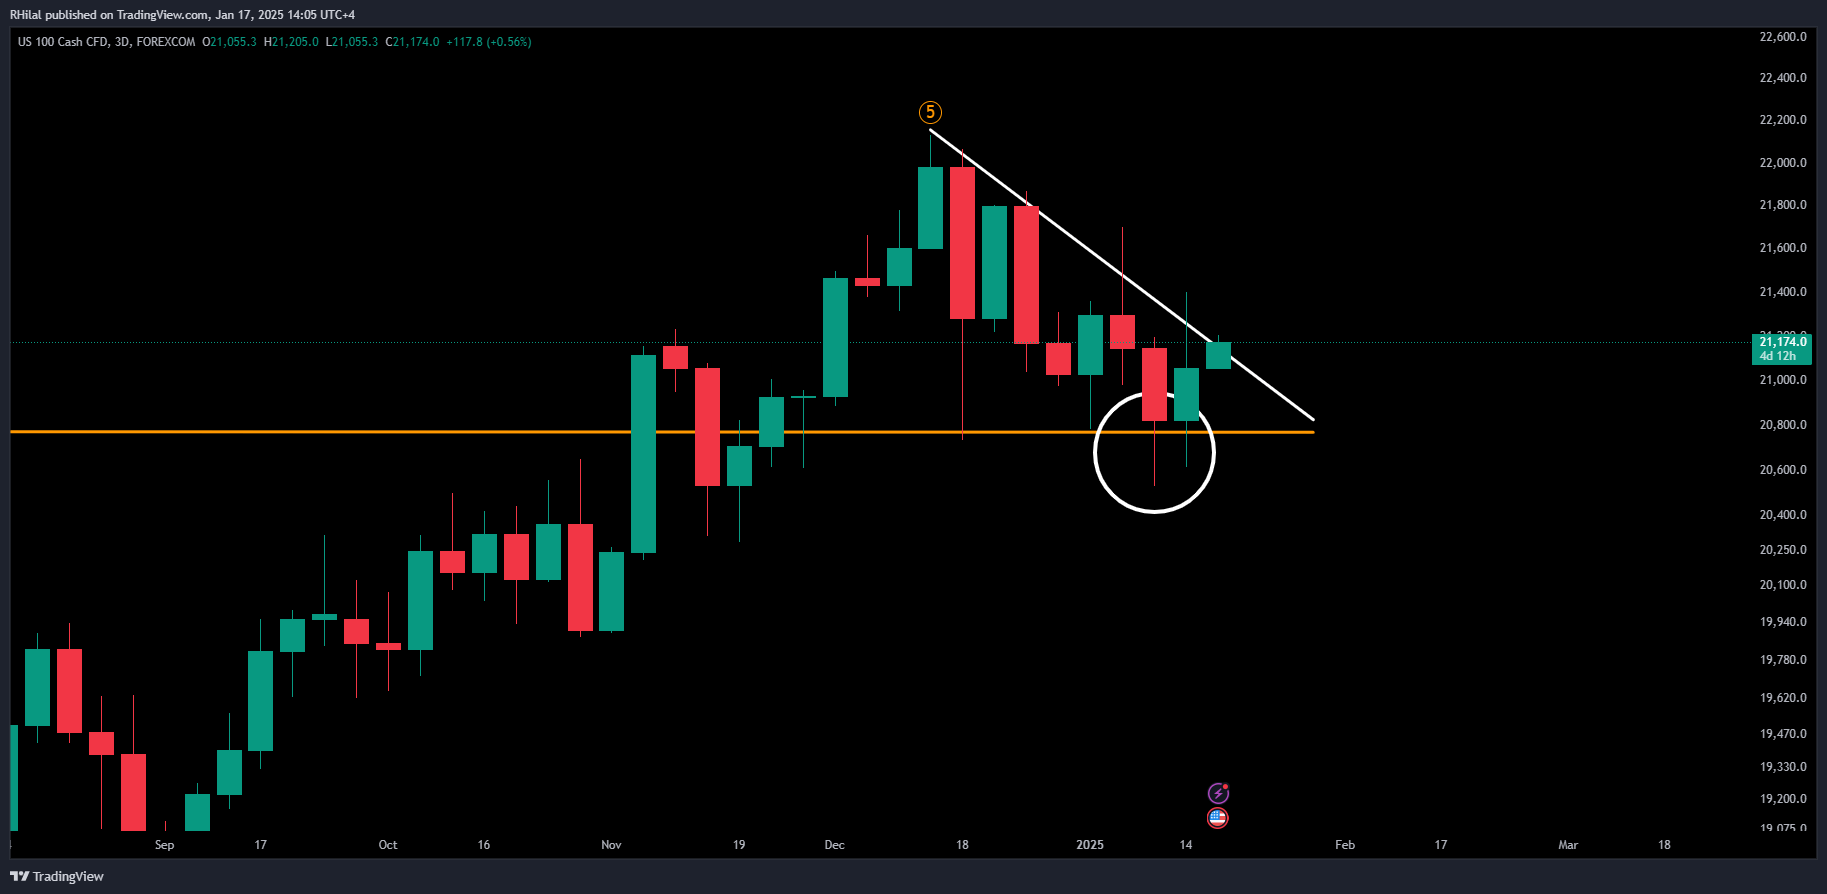
The Nasdaq is holding the borders of its primary uptrending channel, established from the 2022 lows, and remains above the critical 20,700-mark. This week, the trend extended wicks down to 20,530, before rebounding above 21,000, reinforcing bullish strength.
The consolidation pattern observed between December 2024 and January 2025 offers potential for measurable breakouts, supported by Fibonacci retracement ratios in the breakout direction.
Key Levels to Watch:
- Downside: A breakout below 20,700 could extend declines toward 20,200, 20,000, and 19,600, aligning with the 0.618 Fibonacci retracement level of the uptrend from August 2024 (17,230) to December 2024 (22,133).
- Upside: Respecting the channel borders and the critical 20,700 support could extend the uptrend toward 21,700, 22,100, and 22,800.

Source: Tradingview
Wicks, or shadows, on a candlestick chart represent sharp price movements that deviate from the mean before reverting. Extended wicks on the lower side indicate an inability to sustain lows, signaling a potential upward bias (bullish). Conversely, extended wicks on the upper side reflect an inability to sustain highs, amplifying a potential downward bias (bearish). These patterns can provide key insights into market sentiment and price dynamics.
Written by Razan Hilal, CMT Follow on X: @Rh_waves On YouTube: Forex.com


